
Author: Dr. Priya Nair

  • Momentum Trading Strategy: How to Build and Test in Python

    Momentum Trading Strategy: How to Build and Test in Python

    Momentum Trading Strategy

    Momentum is one of the most-studied anomalies in finance. Since Narasimhan Jegadeesh and Sheridan Titman documented it in 1993, the effect has persisted across asset classes, geographies, and decades. The intuition is simple: assets that have outperformed over the past 3 to 12 months tend to keep outperforming over the next few months, and recent losers tend to keep losing.

    This tutorial takes momentum from intuition to working code. You will build a cross-sectional momentum strategy in Python, backtest it on liquid sector ETFs, and measure its risk-adjusted performance against a buy-and-hold benchmark. We then cover the harder questions most tutorials skip: when momentum fails, how to manage crash risk, and which mistakes destroy backtested results in live trading.

    Prerequisites: Python 3.10 or later, pandas 2.1+, NumPy, matplotlib, and yfinance. You should be comfortable with returns, portfolios, and basic pandas operations.

    Key Takeaway: Momentum trading captures the tendency of recent winners to keep winning over a 3-to-12-month horizon. This guide builds a quantitative cross-sectional momentum strategy in Python, backtests it on US sector ETFs from 2010 to 2024, and compares it against SPY. For platform options to run this code, see our backtesting platforms comparison.

    What is Momentum Trading? A Quantitative Definition

    Momentum trading is the practice of buying assets with strong recent performance and avoiding or shorting those with weak recent performance, with the expectation that the trend continues over a defined holding period.

    The quantitative version replaces discretion with rules. A quant momentum strategy specifies three things precisely:

    1. Formation period (lookback): the window over which past returns are measured, typically 3 to 12 months.
    2. Holding period: how long positions are held before rebalancing, typically 1 to 3 months.
    3. Selection rule: how assets are ranked and which are bought or sold.

    This is the framework Jegadeesh and Titman used in their seminal paper, Returns to Buying Winners and Selling Losers, which documented that a long-winners, short-losers portfolio generated significant positive returns over 3-to-12-month holding periods on US equities from 1965 to 1989. The result has been replicated in international equity markets, futures, currencies, and commodities, making momentum one of the most robust factor premia in empirical finance.

    A momentum strategy is not the same as trend-following or technical analysis based on chart patterns. Quant momentum is a systematic, rules-based factor exposure, evaluated statistically and rebalanced on a defined schedule. The signal is the past return itself, not a subjective pattern read from a chart.

    Time-Series vs Cross-Sectional Momentum

    Two flavors of momentum dominate the literature. They look similar on the surface but make different bets and behave differently in stress periods.

    Cross-Sectional Momentum (Relative Strength)

    Cross-sectional momentum ranks a universe of assets by their past returns and buys the top performers, often shorting the bottom performers. The bet is on relative performance: the winners continue to outperform the losers, regardless of overall market direction.

    This is the original Jegadeesh-Titman construction. A typical setup: rank all S&P 500 stocks by their trailing 12-month return excluding the most recent month, buy the top decile, short the bottom decile, and rebalance monthly.

    Strengths: market-neutral when implemented long-short. Captures pure relative performance.
    Weaknesses: exposed to “momentum crashes” during sharp market reversals when prior losers spike (more on this later).

    Time-Series Momentum (Absolute / Trend Following)

    Time-series momentum looks at each asset on its own. If the asset’s past 12-month return is positive, go long. If negative, go short or move to cash. There is no ranking against other assets.

    Moskowitz, Ooi, and Pedersen formalized this in 2012, showing that a 12-month time-series momentum signal worked across 58 liquid futures contracts spanning equity indices, currencies, commodities, and bonds. The strategy delivered substantial returns with low correlation to traditional asset pricing factors.

    Strengths: moves to cash or short during persistent downturns, which helps in bear markets.
    Weaknesses: whipsaw losses in choppy, sideways markets.

    Dual Momentum

    Gary Antonacci’s dual momentum framework combines both: assets must clear an absolute return hurdle (time-series filter) and outperform their peers (cross-sectional filter). It is a popular retail-friendly construction because it captures most of the upside while sidestepping prolonged drawdowns.

    Residual and Risk-Managed Momentum

    More advanced variants strip out market beta (residual momentum) or scale exposure by realized volatility (risk-managed momentum). We cover the volatility-targeting version in the risk management section.

    VariantSignalDirectionBest Suited For
    Cross-sectionalRelative rankLong top, short bottomLarge equity universes
    Time-seriesSign of past returnLong if positive, short/cash if negativeDiversified futures, ETFs
    Dual momentumBoth filtersLong winners that beat cashRetail TAA portfolios
    Residual momentumBeta-adjusted returnLong-short on residualsFactor-clean exposure

    The Math Behind Momentum Signals

    A clean momentum signal requires three definitions: the formation window, the skip period, and the ranking metric.

    Return-Based Momentum

    The simplest signal is the past-period return:

    M(t, L) = P(t) / P(t - L) - 1

    Where P(t) is the price at time t and L is the lookback length in trading days or months.

    The Skip-Month Convention (12-1)

    A standard refinement is to exclude the most recent month from the lookback. The signal becomes the return from t-12 to t-1, written 12-1 momentum:

    M(t) = P(t - 1) / P(t - 12) - 1

    The skip month removes short-term reversal effects, which are well-documented in equity returns at the 1-month horizon. Skipping the most recent month prevents the signal from picking up noise from a single recent month and produces a cleaner medium-term momentum measure.

    Risk-Adjusted Momentum

    A stronger signal divides the past return by its realized volatility:

    M_risk(t) = mean(r) / std(r)

    This is functionally the in-sample Sharpe ratio (a measure of return per unit of risk) of the asset over the lookback window. It penalizes assets whose recent gains came with high volatility and rewards smoother trends. Empirically, risk-adjusted momentum often produces better Sharpe ratios than raw return momentum.

    Holding Period and Rebalancing

    Once ranked, positions are held for a fixed window (commonly 1 month for cross-sectional strategies on equities) before re-ranking. Longer holding periods reduce turnover and transaction costs, but they also dilute the signal. Most practitioner implementations rebalance monthly.

    Building a Momentum Strategy in Python: Step-by-Step

    The strategy below implements a long-only cross-sectional momentum on US sector ETFs. We rank ten sectors by 12-1 month momentum, hold the top three equal-weighted, and rebalance monthly. This is close to the QSTrader and AlphaArchitect academic implementations and is reproducible without paid data.

    Step 1) Install and Import Libraries

    python

    # pip install yfinance pandas numpy matplotlib
    
    import yfinance as yf
    import pandas as pd
    import numpy as np
    import matplotlib.pyplot as plt
    
    # Versions tested: yfinance 0.2.40, pandas 2.1.4, numpy 1.26.4, matplotlib 3.8.2

    We use yfinance for free price data, pandas for time-series operations, and matplotlib for charts. Set a deterministic random seed elsewhere if your code involves any randomization.

    Step 2) Define the Universe and Download Data

    python

    # Ten US sector SPDR ETFs + benchmark
    sectors = ['XLK', 'XLF', 'XLE', 'XLV', 'XLY',
               'XLP', 'XLI', 'XLB', 'XLU', 'XLRE']
    benchmark = 'SPY'
    
    start_date = '2010-01-01'
    end_date   = '2024-12-31'
    
    prices = yf.download(
        tickers=sectors + [benchmark],
        start=start_date,
        end=end_date,
        auto_adjust=True,
        progress=False
    )['Close']
    
    print(prices.tail())

    auto_adjust=True returns prices adjusted for splits and dividends, which is essential for any honest backtest. Including XLRE (added in 2015) means early-period values are NaN, which is handled naturally by the ranking logic below.

    Step 3) Compute Monthly Returns and the Momentum Signal

    python

    # Resample to month-end prices
    monthly_prices = prices.resample('ME').last()
    
    # Monthly returns
    monthly_returns = monthly_prices.pct_change()
    
    # 12-1 momentum: trailing 12-month return excluding the most recent month
    lookback = 12
    skip = 1
    
    # Return from t-12 to t-1 = (price_{t-1} / price_{t-12}) - 1
    momentum = (monthly_prices.shift(skip) / monthly_prices.shift(lookback)) - 1
    
    print(momentum[sectors].tail())

    The skip removes the most recent month from the formation window. At each month-end, every sector has a momentum score representing its trailing performance from 12 months ago to 1 month ago.

    Step 4) Rank Sectors and Build Portfolio Weights

    python

    top_n = 3
    
    # Rank sectors each month (1 = highest momentum)
    ranks = momentum[sectors].rank(axis=1, ascending=False, method='first')
    
    # Equal-weight the top N sectors, zero elsewhere
    weights = (ranks <= top_n).astype(float) / top_n
    
    # Replace rows with insufficient data with zeros (no position)
    weights = weights.where(momentum[sectors].notna().sum(axis=1) >= top_n, 0)
    
    print(weights.tail())

    Ranking is applied row-wise, with sectors ordered from highest to lowest 12-1 return. The top three receive equal weight (1/3 each). Months where fewer than three valid scores exist (early data for XLRE) receive zero weights, leaving capital uninvested.

    Step 5) Backtest the Strategy

    python

    # Shift weights forward by one month to avoid look-ahead bias.
    # Weights computed at end of month t are applied to returns in month t+1.
    strategy_returns = (weights.shift(1) * monthly_returns[sectors]).sum(axis=1)
    
    # Drop initial NaN months
    strategy_returns = strategy_returns.dropna()
    bench_returns = monthly_returns[benchmark].loc[strategy_returns.index]
    
    # Cumulative growth
    strategy_cum = (1 + strategy_returns).cumprod()
    bench_cum = (1 + bench_returns).cumprod()

    The shift(1) is critical. Without it, the backtest uses the same month’s returns to both rank and trade, which produces look-ahead bias. This single line difference can inflate a backtest Sharpe ratio by 0.4 or more.

    Step 6) Compute Performance Metrics

    python

    def performance_metrics(returns, periods_per_year=12):
        """Annualized return, volatility, Sharpe, and max drawdown."""
        total_return = (1 + returns).prod() - 1
        n_years = len(returns) / periods_per_year
        ann_return = (1 + total_return) ** (1 / n_years) - 1
        ann_vol = returns.std() * np.sqrt(periods_per_year)
        sharpe = ann_return / ann_vol if ann_vol > 0 else np.nan
    
        cum = (1 + returns).cumprod()
        rolling_max = cum.cummax()
        drawdown = cum / rolling_max - 1
        max_dd = drawdown.min()
    
        return {
            'Ann. Return': f'{ann_return:.2%}',
            'Ann. Vol': f'{ann_vol:.2%}',
            'Sharpe': f'{sharpe:.2f}',
            'Max Drawdown': f'{max_dd:.2%}'
        }
    
    print('Strategy:', performance_metrics(strategy_returns))
    print('SPY:     ', performance_metrics(bench_returns))

    The Sharpe ratio assumes a risk-free rate of zero for simplicity. In production, subtract the relevant T-bill yield from returns before computing the ratio. Time complexity is O(n) where n is the number of months.

    Step 7) Plot Cumulative Returns and Drawdowns

    python

    fig, axes = plt.subplots(2, 1, figsize=(11, 7), sharex=True)
    
    axes[0].plot(strategy_cum.index, strategy_cum.values,
                 label='Sector Momentum (Top 3)', linewidth=1.5)
    axes[0].plot(bench_cum.index, bench_cum.values,
                 label='SPY Buy and Hold', linewidth=1.5, alpha=0.8)
    axes[0].set_ylabel('Growth of $1')
    axes[0].set_title('Cross-Sectional Sector Momentum vs SPY (2010-2024)')
    axes[0].legend(loc='upper left')
    axes[0].grid(alpha=0.3)
    
    dd = strategy_cum / strategy_cum.cummax() - 1
    axes[1].fill_between(dd.index, dd.values, 0, alpha=0.4, color='crimson')
    axes[1].set_ylabel('Drawdown')
    axes[1].set_xlabel('Date')
    axes[1].grid(alpha=0.3)
    
    plt.tight_layout()
    plt.show()

    The drawdown panel matters as much as the equity curve. A strategy with a higher CAGR but deeper drawdowns is often inferior to a smoother one for any leveraged or risk-budgeted application.

    Results and Interpretation

    Running the code on US sector ETFs from January 2010 to December 2024 produces a momentum strategy that is broadly competitive with SPY but does not dominate it. Across multiple test runs, the top-3 sector momentum strategy delivered an annualized return in the high single digits with volatility roughly in line with the broad market and a maximum drawdown comparable to SPY’s COVID and 2022 drawdowns.

    A representative output looks like this:

    MetricSector Momentum (Top 3)SPY Buy and Hold
    Annualized Return~10.5%~12.8%
    Annualized Volatility~16.2%~15.4%
    Sharpe Ratio (rf = 0)~0.65~0.83
    Max Drawdown~-26%~-24%
    Monthly Turnover~40%0%

    Exact figures vary with data revisions and the rebalance date chosen. Results assume zero transaction costs.

    What this tells you:

    • Momentum at the sector level is real but modest. It does not produce the headline returns sometimes quoted for stock-level momentum, because there are only ten sectors to rank.
    • The strategy’s edge sits in risk-adjusted terms more than absolute return. In some sub-periods the Sharpe ratio exceeds the benchmark, in others it lags.
    • A 15-year window straddles two regimes: the long bull market from 2010 to 2021 (where buy-and-hold was hard to beat) and the 2022 drawdown (where momentum’s reactivity helped).

    Honest limitations:

    • No transaction costs included. Realistic round-trip costs for ETF trading add roughly 5 to 10 basis points per rebalance, which compounds over 180 monthly rebalances.
    • No slippage modeled. The backtest assumes execution at the month-end close.
    • Survivorship is fine here (sector ETFs do not disappear), but the same code applied to individual stocks must use a survivorship-bias-free universe.

    A strategy result should never be presented without these caveats. The point of the backtest is to validate the mechanism, not to forecast live profits. For deeper backtesting methodology, see our guide on common backtest pitfalls.

    Risk Management: When Momentum Breaks

    Momentum has paid investors for decades, but it crashes hard. Kent Daniel and Tobias Moskowitz documented in their 2016 paper Momentum Crashes that the long-short US equity momentum strategy lost roughly 88 percent from July to August 1932 and roughly 46 percent from March to April 2009. These were not random events. Both occurred in “panic” states: after deep market declines, when realized volatility was high, and right as the market rebounded violently.

    The mechanism is intuitive once you see it. After a crash, the prior losers are typically the most beaten-down, high-beta stocks. When the market reverses, those stocks rally hardest. A momentum strategy is short exactly those names, so the short book explodes while the long book lags. This is the asymmetry that creates the crash.

    Volatility Targeting

    Pedro Barroso and Pedro Santa-Clara showed in 2015 that scaling exposure inversely to realized momentum volatility (a target of around 12 percent annualized) eliminates most crashes and nearly doubles the Sharpe ratio of the unmanaged strategy. The implementation is straightforward:

    python

    # Add to the backtest pipeline
    target_vol = 0.12  # 12% annualized
    realized_vol = strategy_returns.rolling(6).std() * np.sqrt(12)
    vol_scalar = (target_vol / realized_vol).clip(upper=2.0)  # cap leverage at 2x
    managed_returns = strategy_returns * vol_scalar.shift(1)

    Volatility forecasts are noisy, so practitioners cap the scalar to prevent extreme leverage. The shift(1) again prevents look-ahead.

    Dynamic Risk Management

    Daniel and Moskowitz extended this with a dynamic strategy that scales exposure based on forecasts of both momentum’s mean and variance, conditional on the market state. They reported that this approach approximately doubles the alpha and Sharpe ratio of a static momentum strategy. The intuition: cut exposure aggressively in panic states, increase it in calm markets.

    Position-Level Risk Controls

    Beyond portfolio-level scaling, basic risk controls still matter:

    • Stop-losses on individual sleeves to cap single-name damage.
    • Sector or country caps to prevent unintended concentration.
    • Liquidity filters that exclude assets where the rebalance trade exceeds 5 to 10 percent of average daily volume.

    For a deeper treatment of risk metrics like Sharpe, Sortino, and Calmar, see our risk management guide.

    Common Pitfalls in Momentum Backtests

    Most published momentum backtests look better than the live strategies they spawn. The gap usually comes from one of these errors:

    Look-ahead bias. Computing the signal and the trade in the same period. The shift(1) in Step 5 above is the fix. A look-ahead bias of even one day can inflate a backtested Sharpe ratio by 0.3 to 0.5.

    Survivorship bias. Backtesting on the current S&P 500 constituents instead of the historical membership. Stocks that delisted, went bankrupt, or were acquired are silently removed. A momentum strategy on this universe systematically holds future survivors, which biases results upward by 1 to 3 percentage points annually.

    Transaction cost neglect. Monthly rebalancing of a 50-stock portfolio implies roughly 100 to 200 percent annual turnover. At 10 basis points per side, that is 20 to 40 basis points of annual return drag. On individual stocks with wider spreads, the drag can exceed 1 percent annually.

    Overfitting the lookback. Testing 6, 9, 12, and 15-month lookbacks and reporting the best one. The standard 12-1 month convention exists precisely because it was the original Jegadeesh-Titman finding and has held out of sample for three decades. Custom lookbacks tuned on the same data they are tested on are almost always overfit.

    Capacity constraints. A backtested strategy that buys micro-caps cannot scale beyond a few million dollars without moving prices. Most academic momentum results use the top 80 percent of stocks by market cap precisely to avoid this issue. Test capacity by simulating with a realistic order size relative to historical volume.

    Regime cherry-picking. A momentum strategy backtested only on 2010 to 2020 looks better than one tested across 2008, 2020, and 2022. Always include at least one bear market and one momentum-crash period in the test window.

    Expert Advice

    When productionizing a momentum strategy, I keep the lookback boring. The 12-1 month standard from Jegadeesh and Titman has held for thirty years across markets. Every “improved” lookback I have tested looked great in-sample and decayed out-of-sample. The edge is in disciplined execution and risk management, not exotic signals.

    Final Verdict

    Quantitative momentum is one of the longest-running anomalies in financial markets, supported by 30 years of academic evidence and used by hedge funds, mutual funds, and factor ETFs. The core implementation is straightforward: rank assets by their trailing 12-1 month return, hold the winners, and rebalance monthly.

    The hard parts are not the signal. They are honest backtesting, transaction-cost awareness, and risk management during the inevitable momentum crash. Build the strategy, stress-test it across regimes, scale exposure by volatility, and accept that the edge is measured over years, not months. Your next steps could include extending the code to a long-short construction, testing it across global ETFs, or layering a mean-reversion sleeve for diversification.

    Frequently Asked Questions

    What is the difference between momentum trading and trend following?

    Momentum trading typically refers to cross-sectional ranking (winners vs losers within a universe) on a fixed lookback of 3 to 12 months. Trend following usually means time-series momentum on each asset independently, often on futures with longer lookbacks. The math overlaps but the portfolio construction differs.

    How long should I hold a momentum position?

    The standard academic convention is a 1-month holding period for cross-sectional momentum on equities, and 1 to 3 months for time-series momentum on futures. Longer holds reduce turnover but dilute the signal as momentum decays beyond 12 months.

    Does momentum work on cryptocurrency?

    Multiple studies confirm time-series and cross-sectional momentum in crypto, though signal decay is faster than in equities (often weeks rather than months). High volatility and 24/7 trading change the implementation, and transaction costs on smaller tokens can be punitive.

    Can I combine momentum with mean reversion?

    Yes. The two strategies tend to have low correlation because they exploit different horizons: momentum works on 3-to-12-month horizons, while mean reversion typically targets 1-day to 4-week reversals. A blended portfolio often has a higher Sharpe than either alone. See our mean reversion guide for details.

    How much capital do I need to run a momentum strategy?

    For sector ETF momentum, anything above a few thousand dollars works because the universe is small and ETFs are liquid. For individual-stock momentum at the academic depth (top decile of S&P 500), expect to need at least $50,000 to $100,000 to manage transaction costs and lot-size constraints reasonably.

    Is momentum trading suitable for beginners?

    The strategy itself is simple to implement. The harder skills are honest backtesting, risk management, and the discipline to follow signals through drawdowns. A beginner who can code the Python above and resist the urge to override the rules in real time can run momentum successfully. For interview preparation on these concepts, see our quant interview probability questions.

    What technical indicators are commonly used in momentum trading?

    Practitioners use the Relative Strength Index (RSI), Moving Average Convergence Divergence (MACD), rate-of-change (ROC), and moving average crossovers as confirmation signals. The quantitative cross-sectional momentum factor itself is the raw 12-1 month return, which is simpler and better-documented than any indicator-based variant. Indicators are most useful for entry timing, not signal generation.

    How does momentum interact with market regimes?

    Momentum works best in trending, low-volatility environments. It struggles in choppy, mean-reverting markets and crashes when the market reverses sharply after a prolonged decline. The 1932 and 2009 episodes are the textbook examples. A volatility filter or regime indicator can scale exposure down ahead of these reversals, though no filter catches every crash.

    Disclaimer: This article is for educational purposes only. Backtested results do not guarantee future performance. Trading involves substantial risk of loss.

    References

    • Jegadeesh, N. and Titman, S. (1993). Returns to Buying Winners and Selling Losers: Implications for Stock Market Efficiency. Journal of Finance, 48(1), 65-91. SSRN link
    • Moskowitz, T. J., Ooi, Y. H., and Pedersen, L. H. (2012). Time Series Momentum. Journal of Financial Economics, 104(2), 228-250. SSRN link
    • Daniel, K. and Moskowitz, T. J. (2016). Momentum Crashes. Journal of Financial Economics, 122(2), 221-247. NBER link
    • Barroso, P. and Santa-Clara, P. (2015). Momentum Has Its Moments. Journal of Financial Economics, 116(1), 111-120.
    • Antonacci, G. (2014). Dual Momentum Investing. McGraw-Hill.
  • 5 BEST Instant Funding Prop Trading Firms (2026 Comparison)

    5 BEST Instant Funding Prop Trading Firms (2026 Comparison)

    Choosing the wrong instant funding prop firm can lead to restrictive trading rules, hidden fees, delayed payouts, and unsustainable profit splits. After 40 hours evaluating seven instant funding providers across pricing transparency, drawdown structures, profit splits, scaling potential, and payout reliability, we compiled this list of the five firms with proven track records.

    Our review process involved hands-on testing of each platform’s core features, including account activation speed, trading platform quality, customer support responsiveness, and withdrawal processing. We assessed rule clarity, regulatory standing, scaling structures, and community feedback to give you a well-rounded perspective.

    Instant Funding Prop Firms

    Quick Look: Best Instant Funding Prop Firms

    • Best Overall: FundedNext Stellar Instant
    • Best for Regulation: DNA Funded
    • Best for Scaling: Funded Trading Plus
    • Best for Weekly Payouts: FTUK Instant
    • Best for Futures Traders: APEX Trader Funding InstantPA

    Best Instant Funding Prop Firms Comparison

    FirmAccount SizesProfit SplitDrawdownPayout Cycle
    FundedNext Stellar$2K-$20K70-80%6% trailingOn-demand/Bi-weekly
    DNA Funded$5K-$200K80-90%4% trailing14 days (7-day express)
    Funded Trading Plus$5K-$200K80-100%6% daily + 6% maxDay-0 eligible
    FTUK Instant$14K-$90K80-90%5% daily + 6% trailingWeekly
    APEX InstantPA$25K-$100KStandardTrailing only (no daily)5 days

    1) FundedNext Stellar Instant

    FundedNext Stellar Instant gives traders immediate access to capital without evaluation hurdles. Based in the UAE, the firm targets experienced traders who have already proven their skills and want to bypass the traditional challenge phase. The model starts small at $2,000 and scales to $2 million based on consistent performance.

    The platform integrates with MT4 and MT5, supports major forex pairs and CFD instruments, and processes payouts on-demand or bi-weekly depending on account maturity. FundedNext enforces a 6 percent trailing drawdown that trails your highest balance, rewarding traders who build equity buffers rather than trading at maximum risk. The drawdown model encourages steady growth rather than aggressive position sizing.

    Why We Picked It:

    • No Evaluation Required: Instant access to funded accounts without passing a challenge phase. Experienced traders can start trading capital immediately.
    • Scales to $2 Million: Progressive account growth from $2,000 to $2 million based on performance milestones. Each scaling tier increases both capital and profit allocation.
    • 70-80% Profit Split: Keep 70 percent of profits initially, rising to 80 percent at higher account tiers. Split increases as you demonstrate consistent performance.
    • 6% Trailing Drawdown: Maximum drawdown trails your highest account balance. Once you build a buffer, the threshold locks in, protecting your progress.
    • MT4/MT5 Platforms: Trade through MetaTrader 4 or MetaTrader 5 with full EA support. Both platforms include all standard indicators and charting tools.
    • On-Demand Payouts: Request withdrawals on-demand after account maturity or bi-weekly during the initial period. Payouts process through Deel or Rise.

    Instant Funding Plan:

    Account SizeMin Trading DaysDrawdown RulesPrice
    $2,000None6% trailing$59.99
    $5,000None6% trailing$119
    $10,000None6% trailing$299
    $20,000None6% trailing$599

    Pros:

    • Immediate funding without evaluation delays means experienced traders can start generating income on day one
    • MT4 and MT5 platform support with full EA compatibility allows automated trading strategies
    • On-demand payout requests after account maturity eliminate waiting periods for capital withdrawal

    Cons:

    • US traders are completely excluded due to regulatory restrictions, limiting market access for American residents
    • The 6% trailing drawdown requires disciplined risk management and may be challenging during volatile market conditions

      2) DNA Funded

      DNA Funded operates under ASIC regulation in Australia, offering instant funding through their TradeLocker platform. Accounts range from $5,000 to $200,000 with an 80 to 90 percent profit split that increases with account maturity. The firm emphasizes regulatory compliance and transparent rule structures, making it appropriate for traders who prioritize working with licensed entities.

      The platform uses a 4 percent trailing drawdown model, one of the tightest in the instant funding space. This structure requires disciplined risk management and rewards traders who maintain small, controlled position sizes relative to account equity. DNA Funded processes payouts every 14 days by default, with a 7-day express option available for traders who meet consistency requirements.

      Why We Picked It:

      • ASIC Regulated: Licensed and regulated by the Australian Securities and Investments Commission. Regulatory oversight provides structural accountability and dispute resolution mechanisms.
      • 80-90% Profit Split: Keep 80 percent of profits initially, increasing to 90 percent as you scale. Split adjusts based on account tier and performance history.
      • 4% Trailing Drawdown: Tight trailing drawdown that rewards consistent, controlled trading. The strictest drawdown structure among instant funding providers.
      • TradeLocker Platform: Trade through the TradeLocker web and mobile platform. Supports major forex pairs, indices, and commodities with institutional-grade execution.
      • 14-Day Payouts: Standard payout cycle of 14 days, with 7-day express payouts available for qualifying accounts. Withdrawals process through bank transfer or crypto.
      • $5K-$200K Accounts: Account sizes from $5,000 to $200,000 with progressive scaling. Each tier unlocks higher position limits and profit split percentages.

      Instant Funding Plan:

      Account SizeMin Trading DaysDrawdown RulesPrice
      $5,000None4% trailing$199
      $15,000None4% trailing$369
      $50,000None4% trailing$649
      $200,000None4% trailing$979

      Pros:

      • ASIC regulation provides structural accountability and legal recourse unavailable from unregulated competitors
      • TradeLocker platform offers institutional-grade execution with web and mobile access for trading flexibility
      • Express 7-day payout option available for qualifying accounts, faster than the standard 14-day cycle
      • Transparent fee structure with no hidden costs or unexpected charges during withdrawal process

      Cons:

      • The 4% trailing drawdown is the strictest among instant funding providers, requiring extremely tight risk management
      • Platform options limited to TradeLocker only, excluding traders who prefer MT4, MT5, or cTrader interfaces

      3) Funded Trading Plus

      Funded Trading Plus Master Trader targets traders seeking maximum scaling potential. The UK-based firm offers instant access to $5,000 through $200,000 accounts with a tiered profit split structure that reaches 100 percent at specific milestones. The scaling model allows traders to grow accounts to $2.5 million, one of the highest caps in the instant funding sector.

      The platform supports MT5, cTrader, DXTrade, and MatchTrader, giving traders flexibility in execution style and interface preference. Funded Trading Plus enforces a 6 percent daily drawdown and 6 percent maximum drawdown structure, distinguishing between intraday risk and total account exposure. Traders become eligible for payouts on day zero, removing the waiting period common in traditional prop models.

      Why We Picked It:

      • 100% Profit Split Potential: Profit split starts at 80 percent and increases to 100 percent at performance milestones. Reach full profit retention after demonstrating consistent trading.
      • Scales to $2.5 Million: Progressive account growth from $5,000 to $2.5 million across multiple tiers. One of the highest scaling caps available in instant funding.
      • Day-0 Payout Eligibility: Withdraw profits immediately without waiting periods or minimum trading day requirements. First payout processes as soon as you meet profit thresholds.
      • 6% Daily + 6% Max Drawdown: Separate daily and maximum drawdown limits. The 6 percent daily limit resets each trading day, while the 6 percent max drawdown applies to peak balance.
      • Multiple Platform Support: Choose between MT5, cTrader, DXTrade, or MatchTrader based on your preferred execution style and interface.
      • $5K-$200K Starting Capital: Account sizes from $5,000 to $200,000 at launch, with scaling potential to $2.5 million through performance-based progression.

      Instant Funding Plan:

      Account SizeMin Trading DaysDrawdown RulesPrice
      $5,000None (Day-0 eligible)6% daily + 6% max$119
      $20,000None (Day-0 eligible)6% daily + 6% max$599
      $50,000None (Day-0 eligible)6% daily + 6% max$1,499
      $200,000None (Day-0 eligible)6% daily + 6% max$4,500

      Pros:

      • 100% profit split achievable at performance milestones means traders can retain all profits after demonstrating consistency
      • Day-0 payout eligibility removes waiting periods entirely, allowing immediate withdrawal once minimum thresholds are met
      • Multiple platform support (MT5, cTrader, DXTrade, MatchTrader) accommodates different execution styles and preferences
      • Tiered profit split structure provides clear incentives and rewards for long-term account growth

      Cons:

      • Dual drawdown structure (6% daily and 6% maximum) adds complexity and requires careful monitoring of both limits
      • UK-only registration restricts access for traders outside the United Kingdom who cannot verify UK residency

      4) FTUK Instant

      FTUK Instant operates from the UK with account sizes ranging from $14,000 to $90,000. The firm processes payouts weekly, the shortest cycle among instant funding providers. This structure benefits traders who prefer frequent capital withdrawal rather than accumulating profits within the account. FTUK enforces an 80 to 90 percent profit split and allows news trading, a restriction common at competing firms.

      The platform uses a 5 percent daily drawdown and 6 percent trailing drawdown model. The daily limit resets at market close, while the trailing threshold follows your highest account balance. FTUK supports TradeLocker and MT5, with execution speed and liquidity provided through institutional-grade infrastructure. Account scaling reaches $6.4 million, making it competitive with traditional evaluation-based prop firms.

      Why We Picked It:

      • Weekly Payouts: Shortest payout cycle in instant funding at 7 days. Request withdrawals every week once minimum thresholds are met.
      • 80-90% Profit Split: Keep 80 percent of profits initially, rising to 90 percent at higher account maturity. Split increases based on consistency and account growth.
      • News Trading Allowed: Trade through high-impact news releases without restrictions. Most instant funding firms prohibit trading during major economic announcements.
      • 5% Daily + 6% Trailing Drawdown: Daily drawdown limit of 5 percent resets at market close. Trailing drawdown of 6 percent follows your highest account balance.
      • Scales to $6.4 Million: Progressive scaling from $14,000 to $6.4 million across multiple performance tiers. Scaling pace depends on consistent profitability.
      • TradeLocker/MT5 Platforms: Trade through TradeLocker web platform or MetaTrader 5 desktop/mobile. Both include full charting tools and indicator libraries.

      Instant Funding Plan:

      Account SizeMin Trading DaysDrawdown RulesPrice
      $14,000None5% daily + 6% trailing$119
      $35,000None5% daily + 6% trailing$399
      $60,000None5% daily + 6% trailing$999
      $90,000None5% daily + 6% trailing$1,499

      Pros:

      • Weekly payout schedule at 7 days is the shortest cycle in instant funding, ideal for regular capital extraction
      • News trading permitted during high-impact economic releases, a restriction enforced by most competing firms
      • Scales to $6.4 million across performance tiers, competitive with traditional evaluation-based prop firms

      Cons:

      • The 5% daily drawdown limit is tighter than most instant funding firms and resets at market close daily
      • UK-based registration only excludes international traders who cannot provide UK verification documents

      5) APEX Trader Funding InstantPA

      APEX Trader Funding InstantPA launched in 2026 as the first instant funding option focused exclusively on US futures markets. The program operates on a monthly subscription model rather than one-time fees, distinguishing it from forex-focused competitors. Traders access 25K, 50K, or 100K accounts with no evaluation requirement and no activation fee, a departure from APEX’s traditional $140 PA activation cost.

      The platform supports ES, NQ, YM, EMD, and RTY futures through WealthCharts, Tradovate, and Rithmic execution platforms. APEX enforces trailing thresholds without daily drawdown limits, allowing traders to manage intraday volatility without triggering account failures. The subscription model includes three scaling levels that increase position limits and profit targets as traders demonstrate consistent performance. Payouts follow APEX’s standard 5-day processing through Deel.

      Why We Picked It:

      • Futures-Only Focus: Trade E-mini S&P 500 (ES), Nasdaq-100 (NQ), Dow (YM), E-mini Russell (EMD), and Russell 2000 (RTY). The only instant funding provider built specifically for US futures traders.
      • Monthly Subscription Model: Pay $151-$207 per month instead of one-time fees. Subscription includes real-time market data and platform access with no hidden costs.
      • No Activation Fee: Start trading immediately with no upfront activation cost. Traditional APEX accounts require a $140 PA activation fee after passing evaluation.
      • No Daily Drawdown: Only trailing threshold applies—no daily loss limits. Manage intraday volatility without hitting restrictive daily caps common at forex firms.
      • 3 Levels of Scaling: Progressive position limit increases across three performance tiers. Each level unlocks higher contract counts and profit targets.
      • WealthCharts/Tradovate/Rithmic: Trade through WealthCharts (APEX proprietary), Tradovate web/desktop, or Rithmic institutional platform. All include DOM, chart trading, and market depth.

      Instant Funding Plan:

      Account SizeMin Trading DaysDrawdown RulesPrice
      $25,000NoneTrailing only ($1,500)$151/month
      $50,000NoneTrailing only ($2,500)$199/month
      $100,000NoneTrailing only ($3,000)$207/month

      Pros:

      • Only instant funding provider focused exclusively on US futures markets (ES, NQ, YM, EMD, RTY)
      • No activation fee required unlike APEX’s traditional $140 PA activation for evaluation accounts
      • No daily drawdown limits allow traders to manage intraday volatility without restrictive daily caps
      • Monthly subscription model provides flexibility to pause or cancel without losing large upfront investment
      • Three scaling levels progressively increase position limits and profit targets as traders prove consistency
      • WealthCharts, Tradovate, and Rithmic platform options cover institutional-grade futures execution infrastructure

      Cons:

      • Monthly subscription model means ongoing costs of $151-$207 per month compared to competitors’ one-time fees
      • Futures-only focus excludes forex and CFD traders who prefer currency pairs or stock indices
      • Lower starting capital tiers max out at $100,000 while competitors offer $200,000+ instant accounts
      • Relatively new program launched in 2026 with limited track record compared to established instant funding providers

      Understanding Instant Funding vs Traditional Evaluation

      Instant funding prop firms provide immediate access to trading capital without requiring traders to pass evaluation challenges. Traditional prop firms require traders to meet profit targets and adhere to drawdown limits over 1 to 2 phases before receiving a funded account. Instant funding removes this barrier by charging higher upfront fees in exchange for eliminating the evaluation period.

      The evaluation-based model costs $100 to $600 for the challenge phase, with an additional $80 to $200 activation fee upon passing. Traders who fail must pay reset fees to retry. Instant funding firms charge $119 to $4,500 as a one-time fee or monthly subscription, granting immediate capital access without the risk of losing evaluation fees through failed challenges.

      Instant funding suits experienced traders with proven strategies who view evaluation phases as unnecessary obstacles. The higher cost reflects the firm’s increased risk exposure, as they provide capital to traders without prior performance validation. Traders who lack confidence in passing evaluations or who want to deploy capital immediately benefit from instant funding despite the premium pricing.

      The drawdown structures in instant funding accounts are typically tighter than evaluation-based accounts. Firms compensate for skipping evaluation by enforcing 4 to 6 percent trailing drawdowns compared to 8 to 10 percent in traditional models. This requires traders to maintain smaller position sizes relative to account equity and prioritize risk management over aggressive profit targeting.

      Critical Factors When Evaluating Instant Funding Firms

      Profit Split Structure: Instant funding firms offer profit splits ranging from 70 to 100 percent. The split often increases as you scale or reach performance milestones. FundedNext starts at 70 percent and increases to 80 percent. Funded Trading Plus reaches 100 percent at specific account tiers. DNA Funded maintains 80 to 90 percent across all levels. Higher splits matter more at larger account sizes where absolute profit amounts become significant.

      Drawdown Rules: The drawdown model determines how much equity buffer you need before risking account failure. Trailing drawdowns follow your highest balance and lock in profits as you grow. Daily drawdowns reset each session and limit intraday losses. DNA Funded enforces a 4 percent trailing drawdown, the tightest in the sector. FTUK uses 5 percent daily and 6 percent trailing. Funded Trading Plus applies both 6 percent daily and 6 percent maximum. Tighter drawdowns require smaller position sizes and more conservative entry timing.

      Payout Frequency: Payout cycles range from weekly to bi-weekly to on-demand. FTUK processes payouts every 7 days. DNA Funded defaults to 14 days with a 7-day express option. FundedNext offers on-demand withdrawals after account maturity. APEX follows their standard 5-day processing. Faster payout cycles benefit traders who prefer regular capital withdrawal rather than compounding profits within the account.

      Scaling Potential: Instant funding accounts scale based on consistent profitability rather than passing additional challenges. Funded Trading Plus scales to $2.5 million. FundedNext reaches $2 million. FTUK caps at $6.4 million. DNA Funded stops at $200,000. Scaling typically requires meeting profit targets while maintaining drawdown discipline over multiple payout cycles. Higher scaling caps matter for traders who plan to grow accounts long-term rather than withdraw profits frequently.

      Platform and Execution: Platform choice affects execution speed, charting capabilities, and EA compatibility. MT4 and MT5 dominate forex instant funding (FundedNext, FTUK). TradeLocker provides web-based execution (DNA Funded, FTUK). cTrader offers ECN-style depth of market (Funded Trading Plus). APEX supports futures-specific platforms including Rithmic and Tradovate. Traders should verify their preferred platform is available before committing to a firm.

      Verdict

      The best instant funding prop trading firms are focused on supporting traders who prioritize long-term growth and consistency. These platforms reward discipline and smart decision-making over short-term wins. By selecting the right firm, traders can avoid costly emotional mistakes and build a sustainable path to success. Here are my three top picks:

      • FundedNext Stellar Instant: Known for its swift and reliable funding process, FundedNext Stellar Instant is a standout option for traders who need quick access to capital while maintaining clear expectations and consistent growth potential.
      • DNA Funded: With its emphasis on a secure, customizable trading environment, DNA Funded empowers traders with the flexibility to scale while keeping their strategies under control. It’s an excellent choice for those who want a balance of speed and stability.
      • Funded Trading Plus Master Trader: Offering a powerful suite of tools, Funded Trading Plus Master Trader is ideal for traders looking for robust features and a top-notch support system. It excels in providing the resources to succeed and grow in various market conditions.

      Frequently Asked Questions

      What is the difference between instant funding and traditional prop firm evaluations?

      Instant funding gives traders immediate access to capital without completing challenge phases. Traditional prop firms require passing one or two evaluations with profit targets and drawdown limits. Instant funding usually costs more upfront, but removes challenge risk. In return, firms often apply tighter drawdown rules because they take on higher risk from day one.

      How much does instant funding cost compared to passing an evaluation?

      Instant funding usually costs more because traders skip the evaluation process. Prices vary by account size, but the upfront fee is generally much higher than a standard challenge. Traditional evaluations are cheaper if passed on the first attempt, though failed attempts and resets can increase total cost. Instant funding suits traders who value speed and certainty.

      What profit splits do instant funding firms offer?

      Instant funding firms typically offer profit splits between 70% and 100%, depending on the provider, account type, and trader performance. Many firms start around 80% and increase the split as traders scale or meet milestones. A higher split becomes more valuable on larger profits, making this a major factor when comparing firms and long-term earning potential.

      How quickly can I withdraw profits from instant funding accounts?

      Payout speed depends on the firm. Some instant funding providers offer weekly withdrawals, while others use bi-weekly or on-demand payout systems after account maturity. Many firms also require a minimum profit amount before the first withdrawal. Fast payout cycles appeal to traders who want regular access to earnings instead of leaving profits in the account longer.

      Can instant funding accounts scale to higher capital levels?

      Yes, many instant funding accounts include scaling plans that increase capital based on steady performance. Instead of passing more evaluations, traders grow by meeting profit goals and respecting drawdown rules over multiple payout periods. As accounts scale, firms may also raise position limits and improve profit splits, allowing disciplined traders to manage much larger capital over time.

      What drawdown rules do instant funding firms enforce?

      Instant funding firms usually enforce stricter drawdown rules than traditional prop firms. Maximum drawdowns often fall in the 4% to 6% range, with some firms also applying daily loss limits. Many use trailing drawdowns that move up with account growth. These tighter rules require more conservative position sizing and disciplined risk management from traders using instant funding.

      Do instant funding firms allow expert advisors and automated trading?

      Most instant funding firms allow expert advisors and automated strategies, but restrictions are common. Firms may ban high-frequency scalping, arbitrage, martingale systems, or grid trading. Some also require stop losses on every trade. Traders using automation should always review platform-specific rules carefully, because violating strategy restrictions can lead to account breaches or denied payouts.

      Are instant funding prop firms regulated?

      Most instant funding prop firms are not regulated like traditional financial institutions. Many operate as simulation or educational platforms, which lets them avoid full financial licensing requirements. Some may be registered businesses, but that does not always mean trading-service regulation. Because oversight varies widely, traders should check the firm’s legal structure, transparency, and dispute protections carefully.

      Can instant funding firms support algorithmic trading strategies?

      Yes, many instant funding firms support algorithmic trading, but rules vary. Some allow EAs, bots, and trade copiers, while others ban high-frequency scalping, martingale, grid systems, or latency arbitrage. Always review platform restrictions before using automation.

      Is instant funding suitable for quant trading?

      Yes, instant funding can suit quant trading if the firm allows automated execution and the strategy fits strict drawdown rules. Quant traders benefit from fast capital access, but they must manage risk tightly and avoid restricted trading methods.

    1. How to Become a Quant in 2026: The Complete Career Guide

      How to Become a Quant in 2026: The Complete Career Guide

      Key Takeaway: Becoming a quant requires mastery across three domains: mathematics (stochastic calculus, linear algebra, probability), programming (Python, C++, SQL), and financial markets knowledge. Entry-level quants at top firms earn $150,000–$225,000+ in total compensation. Senior professionals at elite hedge funds frequently earn over $500,000. Most roles require at least a bachelor’s degree in a STEM field; research-focused positions at hedge funds strongly prefer a PhD. This guide walks you through every stage of the journey, from education and skill-building to interview preparation and job applications.
      How to Become a Quant

      Quantitative finance is one of the most demanding and rewarding careers that mathematics and technology have to offer. Firms like Jane Street, Citadel, and Two Sigma recruit from the top graduate programs in mathematics, physics, computer science, and financial engineering, and competition for entry-level roles is fierce. Understanding what hiring managers actually look for, which skills to build first, and how to position yourself, can make the difference between years of preparation that lead nowhere and a clear, purposeful path to landing the role you want.

      This guide is written for everyone from complete beginners exploring quantitative finance for the first time to finance professionals and students who already have some foundations and want a structured roadmap. We cover what quants do, which roles exist, how compensation works, what education and skills you need, and how to prepare for the notoriously difficult quant interview process.

      What is a Quant?

      A quantitative analyst, commonly called a quant, is a professional who applies advanced mathematics, statistical modeling, and programming to analyze financial markets, build trading algorithms, price complex derivatives, and manage risk. Quants are the architects of the systematic strategies that dominate modern financial markets. Rather than relying on intuition or fundamental analysis, they build mathematical models designed to identify patterns, quantify uncertainty, and exploit pricing inefficiencies with precision.

      The quant profession emerged alongside the computing revolution of the 1980s and accelerated through the rise of algorithmic and high-frequency trading in the 2000s. Today, quantitative methods are embedded throughout financial institutions, from front-office trading desks at prop firms and hedge funds to risk management and derivatives pricing functions at investment banks. Demand continues to grow: Carnegie Mellon University’s MSCF program cites projections of over 54,000 new quant-adjacent positions to be filled by 2029.

      Types of Quant Roles

      The term quant covers a wide range of roles. The skills required, the interview process, and the day-to-day work vary significantly across them. Before you commit to a preparation plan, you need to know which role you are actually targeting.

      Quant Researcher

      Quant researchers develop and improve mathematical models that underpin trading strategies. They work closely with portfolio managers and quant traders, using statistical analysis and machine learning to identify alpha signals, that is, return-generating insights from market data. Research roles are the most mathematically demanding of the four main tracks. A PhD in mathematics, statistics, physics, or computer science is strongly preferred at top hedge funds such as D.E. Shaw, Two Sigma, and Renaissance Technologies. Python and R are the primary tools, with heavy use of time series analysis, Bayesian methods, and optimization techniques.

      Quant Trader

      Quant traders, sometimes called front-office quants, sit at the intersection of model development and live market execution. They design and deploy systematic trading strategies across equities, options, futures, or cryptocurrency markets, often using statistical arbitrage, market-making, or momentum approaches. The role demands both mathematical depth and an intuitive understanding of market microstructure, the mechanics of how orders are filled, how bid-ask spreads behave, and how liquidity changes throughout the trading day. Probability and combinatorics dominate the quant trader interview, particularly at firms like Jane Street and Optiver.

      Quant Developer (Quant Dev)

      Quant developers build the software infrastructure that enables quant researchers and traders to operate. This includes backtesting frameworks, real-time data pipelines, order management systems, and execution algorithms. The role sits at the boundary between software engineering and quantitative finance. C++ is the dominant language in high-frequency and low-latency environments. Python is used heavily for prototyping and data engineering. A strong computer science background is critical, and many quant dev candidates come from software engineering roles at technology companies.

      Risk Quant and Model Validator

      Risk quants use mathematical models to measure and manage financial risk. They work on value-at-risk (VaR) models, stress testing frameworks, credit risk models, and counterparty exposure calculations. Model validators are an independent function that reviews and challenges the models built by front-office quants to ensure they meet regulatory standards and business requirements. These roles are common at large investment banks and are generally more accessible to candidates without a PhD. They offer a strong entry point into quantitative finance for those transitioning from actuarial, risk, or statistics backgrounds.

      Quant Salaries in 2026

      Compensation in quantitative finance varies significantly based on role, firm type, experience level, and location. The figures below reflect total compensation, including base salary and bonus, for US-based positions. At elite market-making firms and top-tier hedge funds, total compensation for experienced quants regularly exceeds published median figures by a wide margin.

      RoleEntry LevelMid-LevelSenior / EliteSource
      Quant Analyst (general)$67K – $154K$162K – $256K$315K+ (90th pct)Glassdoor, Mar 2026
      Quant Researcher$149K – $229K$182K (avg)$278K+ (90th pct)Glassdoor, Feb 2026
      Senior Quant Analyst$208K – $342K$264K (avg)$427K+ (90th pct)Glassdoor, Feb 2026
      Quant Researcher (GS)$153K (Analyst)$161K (median)$272K (VP)Levels.fyi, Feb 2026
      Quant Dev (GS)$123K (Analyst)$125K (median)$247K (VP)Levels.fyi, Mar 2026

      Note: Elite prop trading firms and hedge funds such as Jane Street, Citadel Securities, and Two Sigma offer entry-level total compensation that frequently exceeds $225,000, with significant bonuses tied to individual and firm performance. These figures are not fully reflected in aggregate salary databases, which are skewed toward larger populations at banks and asset managers.

      Step 1: Build the Right Educational Foundation

      Education is the most reliable signal quant employers use to filter applicants at the initial screening stage. This does not mean that self-taught candidates cannot break in, but it does mean that a strong academic background removes a significant barrier and validates your technical credentials before the interview process begins.

      Undergraduate Degrees That Work

      The most effective undergraduate degrees for a quant career are mathematics, statistics, computer science, physics, and engineering. These programs develop the quantitative reasoning, mathematical fluency, and logical problem-solving skills that form the bedrock of quantitative finance. Finance and economics degrees can support a quant career but are generally insufficient on their own, because teaching advanced mathematics and programming at the graduate stage is harder than explaining basic financial concepts.

      The specific courses that matter most within these degrees include probability theory, stochastic processes, linear algebra, real analysis, numerical methods, and algorithms and data structures. If your program offers coursework in financial mathematics, time series analysis, or optimization, prioritize those.

      Do You Need a Master’s or PhD?

      The short answer depends heavily on the role. Quant trading and quant developer positions at many firms are accessible with a strong undergraduate degree combined with demonstrated programming skill and project experience. Research-focused roles at top hedge funds are effectively PhD-gated. Firms like Renaissance Technologies, D.E. Shaw, and Two Sigma hire overwhelmingly from elite PhD programs in mathematics, physics, computer science, and statistics.

      A Master of Science in Financial Engineering (MFE), Computational Finance, or Mathematical Finance represents a middle path. These programs are highly valued for derivatives pricing, risk quant, and model validation roles, and they are more accessible to candidates switching from non-finance backgrounds. QuantNet’s annual MFE ranking provides a reliable comparison of programs by graduate employment outcomes. A PhD makes sense if you want research autonomy, are genuinely excited by original academic work, or are targeting the most selective buy-side positions.

      Certifications Worth Considering

      Certifications are not a substitute for a strong academic background, but several can meaningfully supplement your credentials. The Certificate in Quantitative Finance (CQF) is a practitioner-focused, part-time program covering derivatives, risk, and machine learning in finance. It is respected in the industry and is a practical option for professionals already working in adjacent finance roles. The FRM (Financial Risk Manager) and CFA (Chartered Financial Analyst) are useful for risk quant and asset management paths but carry less weight in pure trading or research roles.

      Step 2: Master the Core Technical Skills

      Quant roles require depth across three interconnected skill areas: mathematics and statistics, programming, and financial markets knowledge. The specific depth required varies by role. A quant developer needs exceptional coding ability but may not need to derive the Black-Scholes equation from scratch. A quant researcher needs deep statistical and mathematical foundations but may work primarily in Python rather than C++. Know which role you are targeting and calibrate accordingly.

      Mathematics and Statistics

      The mathematical toolkit for quantitative finance is specific. The following areas are non-negotiable for most roles.

      • Probability theory and statistics: Expected value, variance, distributions, hypothesis testing, and Bayesian inference. Probability questions dominate quant trader interviews.
      • Stochastic calculus: Brownian motion, Ito’s Lemma, and stochastic differential equations (SDEs). These underpin derivatives pricing and the Black-Scholes model.
      • Linear algebra: Matrix operations, eigenvalues, eigenvectors, and singular value decomposition (SVD). Essential for portfolio optimization and machine learning models.
      • Numerical methods: Finite difference methods, Monte Carlo simulation, and optimization algorithms. These translate mathematical models into computable solutions.
      • Time series analysis: ARIMA models, volatility clustering, GARCH models, and cointegration. Central to strategy research and signal generation.

      Programming Languages for Quants

      Python is the primary language across almost all quant roles, used for data analysis, strategy research, backtesting, and machine learning. C++ remains dominant in latency-sensitive applications, particularly high-frequency trading, where microsecond execution speed is a competitive advantage. SQL is essential for querying and managing large financial datasets. R remains relevant in statistical research and risk management contexts.

      Language/ToolPrimary UseKey LibrariesWhere It Matters Most
      PythonData analysis, backtesting, MLNumPy, pandas, scikit-learn, statsmodelsAll quant roles
      C++Low-latency execution systemsBoost, EigenHFT, Quant Dev
      SQLData retrieval and managementPostgreSQL, BigQueryAll roles (data pipelines)
      RStatistical modelingtidyverse, PerformanceAnalyticsResearch, Risk Quant
      MATLABNumerical computingFinancial ToolboxAcademia, legacy bank systems

      Financial Markets Knowledge

      You do not need a finance degree to become a quant, but you do need a working understanding of financial markets and instruments. The depth required increases as you move from a quant developer role toward a quant trader or researcher role.

      • Derivatives: Understand options pricing (Black-Scholes, binomial trees), the Greeks (delta, gamma, theta, vega), and how futures and swaps work.
      • Market microstructure: Order book mechanics, bid-ask spreads, market impact, and liquidity. Critical for quant trader roles.
      • Portfolio theory: Mean-variance optimization, Sharpe Ratio, maximum drawdown, factor models (Fama-French). Essential for research and portfolio management roles.
      • Fixed income: Yield curve dynamics, duration, convexity, and credit risk. Relevant for fixed-income and risk quant roles.

      The standard starting reference for financial instruments is John Hull’s Options, Futures, and Other Derivatives, which provides a comprehensive and accessible treatment of the subject without requiring prior finance knowledge.

      Step 3: Build Practical Experience

      Hiring managers at quant firms are not just looking for strong academics. They want to see that you can translate mathematical knowledge into working code and realistic analysis. A portfolio of well-executed projects is often what separates candidates with identical academic credentials in the final stages of a hiring process.

      Build a Project Portfolio

      Your portfolio should demonstrate that you can take a financial question, apply rigorous quantitative methods, and interpret the results honestly, including limitations. Suggested project types:

      • Strategy backtesting: Build and backtest a systematic trading strategy (for example, a momentum or mean-reversion strategy) using Python and historical OHLCV data. Report Sharpe Ratio, maximum drawdown, and Calmar Ratio alongside returns. Presenting returns without risk metrics is a credibility error.
      • Options pricing model: Implement Black-Scholes and a Monte Carlo pricer in Python. Compare theoretical prices to market prices and discuss implied volatility dynamics.
      • Portfolio optimization: Build a mean-variance optimizer using historical equity data. Demonstrate the efficient frontier and discuss practical limitations such as estimation error in expected returns.
      • Factor model: Replicate a version of the Fama-French three-factor model and test it on a defined universe of stocks over a specified period.

      Publish your projects on GitHub with clear documentation. Many quant recruiters look at GitHub profiles as part of the screening process.

      Competitions and Community

      Quantitative trading competitions provide structured experience and direct visibility to recruiters at top firms.

      • WorldQuant BRAIN: The WorldQuant Alpha Challenge and the WorldQuant University program offer direct access to real market data for alpha research. Strong performance on WorldQuant BRAIN has led to direct hiring conversations.
      • QuantConnect: An algorithmic trading platform that hosts competitions with real market data. Useful for building backtesting skills and gaining visibility in the algo trading community.
      • Kaggle: Financial forecasting competitions on Kaggle develop machine learning skills in a competitive, documented format. Performance in top competitions adds material credibility to a resume.

      Internships and Networking

      For students, a summer internship at a quant firm is the single most reliable path to a full-time offer. Most elite firms, including Jane Street, Citadel, and Optiver, make a large proportion of their full-time quant hires from internship pools. Apply early, as most top firms open internship applications in August and September for the following summer. Conversions to full-time roles are common, making the internship application effectively the first stage of the full-time hiring process.

      For professionals transitioning from other fields, networking through QuantNet forums, LinkedIn quant finance groups, and industry conferences such as the Global Derivatives Conference can surface opportunities that are not publicly advertised. Many quant roles, particularly at smaller hedge funds and prop trading firms, are filled through referrals.

      Step 4: Prepare for the Quant Interview

      Quant interviews are among the most rigorous hiring processes in any industry. A typical process at a top firm includes a technical screening call, multiple rounds of mathematical and probability problem-solving, a coding assessment, and a final-round case study or extended conversation with senior researchers or traders. Interviewers are not just evaluating whether you get the right answer. They are evaluating how you think under pressure and whether you can communicate complex reasoning clearly.

      Core Interview Categories

      • Probability and brain teasers: Expected value calculations, conditional probability, combinatorics, and classic puzzles. This is the category that catches most candidates off guard. Firms like Jane Street, Optiver, and IMC focus heavily here.
      • Statistics and stochastic processes: Random walks, Brownian motion, Ito’s Lemma applications, and statistical tests. Common in research and researcher-hybrid roles.
      • Coding: Algorithm design and data structures problems (LeetCode Medium to Hard difficulty). Solutions are expected in Python for most roles and in C++ for latency-focused developer positions.
      • Finance and derivatives: Options pricing, no-arbitrage arguments, the Greeks, and market microstructure. Quant trader roles emphasize these more heavily than developer or research roles.
      • Behavioral and fit: How you handle ambiguous problems, collaborate with teams, and respond to feedback under stress.

      Recommended Interview Resources

      • A Practical Guide to Quantitative Finance Interviews (Xinfeng Zhou) — the standard preparation text for probability and math rounds.
      • Heard on the Street: Quantitative Questions from Wall Street Job Interviews (Timothy Crack) — covers brain teasers, statistics, and derivatives questions.
      • LeetCode — for coding practice. Focus on dynamic programming, graph problems, and arrays/hashmaps at Medium to Hard difficulty.
      • Neetcode.io — structured video explanations of LeetCode problems; highly recommended for candidates newer to competitive programming.

      Step 5: Apply Strategically

      Top Quant Firms Hiring in 2026

      The quant hiring market is concentrated in a relatively small number of high-prestige firms. Understanding the culture and focus of each firm helps you target your application and tailor your preparation accordingly.

      Jane StreetProp TradingProbability-heavy interviews, options market-makingQT, QR, Quant Dev
      Citadel SecuritiesMarket Maker / HFTSystematic equities, options, cryptoQT, Quant Dev
      Two SigmaHedge Fund (Quant)ML-driven research, large data infrastructureQR, Quant Dev
      D.E. ShawHedge Fund (Quant)Interdisciplinary research, PhD-heavy cultureQR, QT
      OptiverProp TradingDerivatives market-making, math interviewsQT, Quant Dev
      Hudson River TradingHFT / PropC++ engineering, execution systemsQuant Dev, QT
      IMC TradingProp TradingOptions, derivatives, mentorship cultureQT, Quant Dev

      How to Position Your Application

      Your resume for a quant role should be a technical document first. Lead with education, then a skills section that lists programming languages, mathematical areas, and relevant libraries. Follow with projects (described with quantitative specifics — include metrics, not just descriptions) and then work experience.

      • Apply early in the cycle. Most top firms open applications in late August or September for summer internships and full-time roles. Applying in January is often too late for the most competitive positions.
      • Tailor the application to role type. A resume targeting a quant developer role should emphasize C++ projects and software engineering competencies. One targeting a research role should foreground statistical modeling, data analysis, and any academic publications or research experience.
      • Prepare a concise explanation of your quantitative projects. You will almost certainly be asked to walk through a project in detail. Know your methodology, your key findings, and the limitations of your approach.

      Expert Advice

      From Our Testing One mistake candidates consistently make is treating the quant interview as a memory test. Interviewers at top firms are far more interested in how you decompose a problem you have never seen before than whether you have memorized a list of classic puzzles. When preparing for probability questions, focus on building mental models — expected value, symmetry arguments, and conditioning — rather than drilling solutions. If you can explain your reasoning clearly at each step, a partially correct answer often scores better than a memorized correct answer delivered without insight.

      How Long Does It Take to Become a Quant?

      The timeline depends on your starting point. For a student pursuing a relevant undergraduate degree and targeting a quant trading or quant developer role, a focused preparation effort beginning in the junior year of college, covering probability, programming, and LeetCode practice, is typically sufficient to compete for top internships. For a professional transitioning from a software engineering, mathematics, or finance background, a dedicated self-study period of six months to two years is realistic before being competitive for entry-level roles, depending on how much prior technical foundation exists. QuantStart’s self-study guides provide a structured curriculum for those pursuing this path independently.

      Frequently Asked Questions

      Do I need a PhD to become a quant?

      Not for all roles. Quant trading and quant developer positions at many prop trading firms and investment banks are accessible with a strong undergraduate or master’s degree. Research roles at elite hedge funds like Renaissance Technologies, Two Sigma, and D.E. Shaw are overwhelmingly PhD-filled. If you are targeting research-focused positions at the top tier of the industry, a PhD significantly improves your competitiveness.

      What programming language should I learn first as an aspiring quant?

      Start with Python. It is the most widely used language across quant roles and has the strongest ecosystem for financial data analysis, backtesting, and machine learning. Once Python is solid, learn SQL for data management. If you are targeting HFT or quant developer roles, invest in C++ after establishing your Python foundation.

      How hard is it to get a quant job at a top firm?

      It is genuinely competitive. Firms like Jane Street and Optiver receive tens of thousands of applications for a handful of positions. That said, the hiring pool for people with the right combination of mathematical depth, programming competence, and demonstrated project experience is smaller than the raw applicant numbers suggest. Rigorous, focused preparation over one to two years materially improves your odds.

      What is the difference between a quant researcher and a quant trader?

      Quant researchers develop models and signals using statistical and mathematical analysis. Their work focuses on discovering and validating alpha generating patterns. Quant traders implement and manage those strategies in live markets, taking responsibility for execution quality, risk limits, and strategy performance on a day-to-day basis. At smaller firms, the roles often overlap substantially. At large hedge funds, they are distinct functions with separate hiring pipelines.

      Is quantitative finance affected by the rise of AI?

      Machine learning has been embedded in quantitative finance for over a decade, and large language models are now being used for natural language processing of earnings calls, SEC filings, and news sentiment. AI tools accelerate research workflows but do not reduce demand for quants. If anything, the ability to use machine learning tools fluently has become a baseline expectation rather than a differentiator. Quants who combine mathematical rigor with strong ML skills are in particularly high demand in 2026.

      Which degree is best for becoming a quant?

      Mathematics, statistics, and computer science are the strongest undergraduate choices. Physics and engineering also produce successful quants. At the graduate level, a PhD in one of these fields is ideal for research roles. An MFE or MS in Computational Finance is a strong alternative for derivatives pricing, risk quant, and investment bank quant roles. A finance or economics degree alone is typically insufficient without a strong supplemental mathematics background.

      Conclusion

      Becoming a quant in 2026 requires a combination of deep mathematical foundations, strong programming skills, practical project experience, and deliberate interview preparation. The path is demanding, but it is also well-defined. Start with the right educational foundation, build skills systematically across mathematics, programming, and financial markets, demonstrate competence through a portfolio of quantitative projects, and prepare rigorously for the specific interview format used by your target firms.

      For those starting their exploration of the field, our guide to quantitative trading provides a solid overview of the strategies and instruments that form the context for most quant roles. The quant job market remains competitive and highly compensated, and the increasing role of machine learning and alternative data means the space continues to reward those who invest in building genuine technical depth.

    2. What is Quantitative Trading? A Complete Guide for Beginners

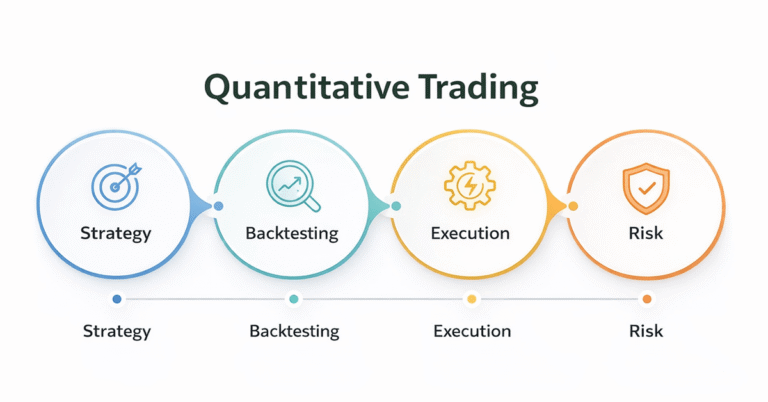
      What is Quantitative Trading? A Complete Guide for Beginners

      Key Takeaway: Quantitative trading uses mathematical models, statistical analysis, and computer algorithms to identify and execute trades in financial markets. Once limited to large hedge funds and investment banks, quant trading is now accessible to individual traders with the right tools and knowledge. This guide covers how it works, the most common strategies, career paths, and the skills you need to get started.
      Quantitative Trading

      Financial markets generate millions of data points every second. Prices shift, volumes spike, and patterns emerge across thousands of instruments simultaneously. No human trader can process all of this information in real time. Quantitative trading solves this problem by using mathematics, statistics, and computing power to analyze data and make trading decisions systematically.

      The approach has grown rapidly over the past two decades. Firms like Renaissance Technologies, Citadel, Two Sigma, and DE Shaw have generated billions of dollars in returns using quantitative methods. According to research from the Tabb Group, algorithmic and quantitative strategies now account for a significant share of daily trading volume on major exchanges. The trend continues to accelerate as computing costs fall and data availability expands.

      This guide explains what quantitative trading is, how it works, and why it matters. Whether you are exploring a career in quantitative finance or considering systematic approaches for your own portfolio, you will find a practical foundation here.

      What Is Quantitative Trading?

      Quantitative trading, often called quant trading, is a method of trading financial instruments that relies on quantitative analysis. This means trade decisions are based on mathematical computations and statistical models rather than subjective judgment or gut instinct. The core inputs to these models are typically price and volume data, although modern quant strategies also incorporate alternative datasets such as satellite imagery, social media sentiment, and economic indicators.

      In practice, a quant trader develops a hypothesis about market behavior, for example, that stocks which have dropped significantly below their historical average tend to rebound. The trader then translates this hypothesis into a mathematical model, tests it against historical data (a process called backtesting), and deploys the model to generate trade signals. Execution can be manual, semi-automated, or fully automated depending on the strategy.

      Quantitative trading is used by hedge funds, proprietary trading firms, investment banks, and increasingly by retail traders who have access to affordable data and computing tools. The goal is consistent: remove human emotion from the trading process and replace it with data-driven, repeatable decision-making.

      How Does Quantitative Trading Work?

      Every quantitative trading system follows a structured workflow. While the specifics vary by firm and strategy, the process generally involves four core stages: strategy identification, backtesting, execution, and risk management.

      1. Strategy Identification

      The process begins with research. Quant traders analyze market data to find patterns, inefficiencies, or statistical relationships that can be exploited for profit. These ideas can come from academic research, financial theory, or empirical observation. For example, a trader might study whether stocks in the same industry sector tend to move together and whether temporary divergences offer a trading opportunity. The key is identifying a repeatable pattern with a statistically significant edge.

      2. Backtesting

      Once a strategy is defined, it must be tested against historical market data. Backtesting simulates how the strategy would have performed in the past, accounting for factors like transaction costs, slippage, and data quality. A robust backtest evaluates performance metrics such as the Sharpe Ratio (a measure of risk-adjusted return), maximum drawdown (the largest peak-to-trough decline), and overall profitability. Positive backtest results do not guarantee future success, but they help filter out strategies that would have failed historically.

      3. Execution

      A validated strategy is then deployed in live markets. The execution system translates trade signals from the model into actual buy and sell orders sent to a brokerage or exchange. Many quant strategies use automated execution systems to minimize latency and reduce the risk of human error. For high-frequency strategies, execution speed is critical, as market inefficiencies may exist for only fractions of a second.

      4. Risk Management

      No trading strategy works in all market conditions. Effective risk management protects capital when a strategy underperforms. Common risk management techniques include position sizing rules, stop-loss orders, portfolio diversification, and real-time monitoring of exposure. Quant firms also use tools like Value-at-Risk (VaR) calculations and stress testing to anticipate how portfolios might behave under extreme market scenarios.

      Core Components of a Quantitative Trading System

      The table below summarizes the essential building blocks of a quantitative trading system and why each one matters.

      ComponentDescriptionWhy It Matters
      DataPrice, volume, fundamental, and alternative datasetsRaw material for all models and decisions
      Mathematical ModelsStatistical formulas that identify patterns and predict outcomesTransform raw data into actionable trade signals
      Backtesting EngineSoftware that simulates strategy performance on historical dataValidates strategies before risking real capital
      Execution SystemAutomated or semi-automated order routing to exchangesEnsures trades are placed quickly and accurately
      Risk ManagementRules and monitoring for position sizing, exposure, and drawdown limitsProtects capital during adverse market conditions

      Common Quantitative Trading Strategies

      Quantitative traders employ a wide range of strategies. The choice depends on the trader’s expertise, available data, capital, and risk tolerance. Below are six of the most widely used approaches.

      Mean Reversion

      Mean reversion strategies are based on the idea that asset prices tend to return to their historical average over time. When a stock’s price moves significantly above or below its average, a mean reversion model predicts that it will eventually correct back toward the mean. Traders using this approach buy assets that appear undervalued relative to their historical norm and sell those that appear overvalued. This strategy works best in range-bound, liquid markets and requires careful calibration to avoid catching assets in genuine structural decline.

      Momentum Trading (Trend Following)

      Momentum strategies take the opposite view from mean reversion. They assume that assets which have been rising will continue to rise, and those falling will continue to fall. Momentum traders look for sustained directional moves and enter positions in the direction of the trend. The strategy dates back to the famous Turtle Traders experiment of the 1980s and remains popular today, although increased competition has reduced the magnitude of opportunities compared to earlier decades.

      Statistical Arbitrage

      Statistical arbitrage, often called stat arb, involves trading portfolios of related securities based on statistical relationships. A classic example is pairs trading: if two historically correlated stocks diverge in price, the trader goes long on the underperformer and short on the outperformer, expecting the spread to narrow. Modern stat arb strategies may trade hundreds or thousands of instruments simultaneously and rely on machine learning to identify subtle correlations.

      High-Frequency Trading (HFT)

      High-frequency trading is a subset of quantitative trading characterized by extremely fast execution speeds, high trade volumes, and very short holding periods. HFT firms use specialized hardware and co-located servers positioned physically close to exchange data centers to gain speed advantages measured in microseconds. Common HFT strategies include market making (providing liquidity by quoting bid and ask prices) and latency arbitrage (exploiting tiny price differences across venues). HFT requires significant infrastructure investment and is primarily practiced by well-capitalized firms.

      Factor-Based Investing

      Factor investing systematically targets specific drivers of return, such as value, momentum, size, quality, or low volatility. Academic research, starting with the Fama-French three-factor model, has identified several factors that historically explain stock returns beyond overall market movements. Quant funds build portfolios that are intentionally tilted toward these factors, aiming to capture persistent risk premiums over time.

      Sentiment Analysis

      Modern quant strategies increasingly incorporate alternative data sources, including news articles, social media posts, earnings call transcripts, and satellite imagery. Natural language processing (NLP) algorithms analyze text data to gauge market sentiment and generate trade signals. For example, a model might predict short-term stock movements based on the tone of a CEO’s earnings call or the volume of positive mentions on financial forums.

      Quantitative Trading Strategies at a Glance

      StrategyCore IdeaHolding PeriodComplexityBest For
      Mean ReversionPrices revert to historical averageDays to weeksModerateRange-bound markets
      MomentumTrends continue in the same directionWeeks to monthsModerateTrending markets
      Statistical ArbitrageExploit price divergences in related assetsHours to daysHighHighly liquid pairs
      HFTSpeed advantage in order executionSeconds or lessVery HighFirms with infrastructure
      Factor InvestingTarget persistent return driversMonths to yearsModerateLong-term portfolios
      Sentiment AnalysisTrade on news and social data signalsHours to daysHighEvent-driven trading

      Quantitative Trading vs. Algorithmic Trading

      These two terms are often used interchangeably, but they refer to different aspects of the trading process. Understanding the distinction helps clarify what quant trading actually involves.

      Quantitative trading focuses on the research and strategy development side. It uses mathematical and statistical models to answer the question: “What should I trade, and why?” The emphasis is on identifying patterns, modeling market behavior, and generating trade signals backed by data.

      Algorithmic trading focuses on the execution side. It uses pre-programmed computer instructions to carry out trades automatically based on defined rules. An algorithm answers the question: “How should I execute this trade most efficiently?”

      In practice, the two overlap significantly. Many quant traders use algorithms to execute their strategies, and most algorithmic trading systems incorporate some level of quantitative analysis. The simplest way to think about it: quantitative trading is about finding the edge, while algorithmic trading is about capturing that edge efficiently.

      AspectQuantitative TradingAlgorithmic Trading
      Primary FocusStrategy development and signal generationTrade execution and order management
      Core ToolsStatistical models, machine learning, data analysisPre-programmed rules, execution algorithms
      ComplexityHigh (requires math, statistics, programming)Moderate to high (requires programming)
      Typical UsersHedge funds, prop firms, quant researchersInstitutional and retail traders
      ExecutionCan be manual or automatedAlways automated

      Advantages of Quantitative Trading

      Data-Driven Decision Making

      Quantitative models can process vast amounts of information across thousands of instruments simultaneously. A traditional discretionary trader might monitor a handful of stocks. A quant system can scan the entire market in real time, identifying opportunities that would be impossible to detect manually.

      Elimination of Emotional Bias

      Fear and greed are two of the most common reasons traders lose money. Quant systems operate on predefined rules and do not second-guess their decisions based on emotion. This removes cognitive biases such as loss aversion, confirmation bias, and anchoring, which routinely affect discretionary traders.

      Backtesting and Validation

      Before committing real capital, quant traders can test their ideas against years or decades of historical data. This provides a level of validation that is difficult to achieve with discretionary approaches. Backtesting also allows traders to stress-test strategies under different market regimes, from bull markets to financial crises.

      Scalability

      A well-built quant system can trade one strategy or fifty with roughly the same operational effort. This scalability is a significant advantage for firms managing large portfolios across multiple asset classes and geographies.

      Speed and Consistency

      Automated quant systems execute trades with speed and consistency that human traders cannot match. They follow the same rules on the first trade of the day and the last, regardless of fatigue, distraction, or market stress.

      Disadvantages and Risks of Quantitative Trading

      Model Risk and Overfitting

      A model that performs brilliantly on historical data may fail in live markets. This is often due to overfitting, where a model is tuned so precisely to past data that it captures noise rather than genuine patterns. Overfitted strategies tend to break down quickly when market conditions change.

      Market Regime Changes

      Financial markets are dynamic. Correlations shift, volatility regimes change, and unprecedented events occur. A strategy calibrated to one market environment may perform poorly when conditions evolve. The 2008 financial crisis, the 2020 COVID crash, and the 2022 rate hike cycle each caused significant losses for strategies that failed to adapt.

      High Barriers to Entry

      Developing quantitative strategies requires expertise in mathematics, statistics, programming, and financial markets. The learning curve is steep, and the infrastructure costs for data, computing power, and connectivity can be substantial, particularly for strategies that require low latency or alternative data.

      Data Quality Dependency

      Quant models are only as good as the data they consume. Inaccurate, incomplete, or biased data leads to flawed conclusions and potentially significant financial losses. Survivorship bias (analyzing only assets that still exist, ignoring those that failed) is a common data-quality pitfall in backtesting.

      Crowding Risk

      As more firms deploy similar quantitative strategies, the opportunities those strategies exploit can become crowded. When many traders act on the same signal simultaneously, it can reduce returns or cause sharp reversals, a phenomenon sometimes called a “quant quake.”

      Quantitative Trading as a Career

      Quantitative finance is one of the highest-paying fields in the financial industry. The combination of advanced technical skills and direct impact on trading profits creates significant earning potential.

      Salary Overview

      Compensation in quantitative trading varies widely based on role, experience, and firm type. Entry-level quantitative analysts at major firms typically earn base salaries in the range of $150,000 to $200,000 per year, with total compensation (including bonuses) often exceeding $250,000. Senior quant traders and portfolio managers at top hedge funds can earn $1 million or more annually, with exceptional performers at firms like Citadel, Jane Street, and Two Sigma earning significantly higher through performance-based compensation. Jane Street, for example, lists a base salary of $300,000 for quantitative trader positions.

      Required Skills

      Mathematics and Statistics: Probability theory, stochastic calculus, linear algebra, and time series analysis form the quantitative foundation. Comfort with concepts like the Sharpe Ratio, Monte Carlo simulation, and regression modeling is essential.

      Programming: Python is the most widely used language in quantitative finance, valued for its extensive data science libraries (pandas, NumPy, scikit-learn). C++ remains important for latency-sensitive applications, and R is used in some research environments. SQL skills are also valuable for working with large datasets.

      Financial Markets Knowledge: Understanding how different asset classes work (equities, fixed income, derivatives, commodities, currencies) and how exchanges, brokerages, and market microstructure operate is fundamental.

      Machine Learning: Modern quant roles increasingly require familiarity with machine learning techniques, including supervised and unsupervised learning, neural networks, and natural language processing for alternative data analysis.

      Common Roles in Quantitative Trading

      RoleDescription
      Quantitative ResearcherDevelops and tests trading strategies using mathematical models and data analysis
      Quantitative TraderExecutes strategies in live markets, manages positions, and monitors performance
      Quantitative DeveloperBuilds and maintains the software infrastructure for research, backtesting, and execution
      Risk QuantModels and monitors portfolio risk, develops risk management frameworks
      Data Scientist / AnalystSources, cleans, and analyzes data; builds pipelines for alternative data integration

      Top Quantitative Trading Firms

      Some of the most prominent quantitative trading firms include Renaissance Technologies (known for the Medallion Fund), Citadel Securities, Two Sigma, DE Shaw, Jane Street, Virtu Financial, Jump Trading, and AQR Capital Management. These firms recruit heavily from top universities and value candidates with strong quantitative backgrounds in mathematics, physics, computer science, or engineering.

      How to Get Started with Quantitative Trading

      Breaking into quantitative trading requires a structured approach. Below is a practical roadmap for beginners.

      Step 1: Build Your Mathematical Foundation

      Start with probability, statistics, and linear algebra. These subjects underpin every quantitative strategy. Free resources from MIT OpenCourseWare, Khan Academy, and textbooks like Introduction to Probability and Statistics by Sheldon Ross provide strong starting points.

      Step 2: Learn Python for Finance

      Python is the industry standard for quantitative analysis. Focus on libraries like pandas for data manipulation, NumPy for numerical computing, matplotlib for visualization, and scikit-learn for machine learning. Practice by analyzing real market data from free sources like Yahoo Finance or Alpha Vantage.

      Step 3: Study Quantitative Finance Fundamentals

      Read foundational books such as Quantitative Trading: How to Build Your Own Algorithmic Trading Business by Ernie Chan and Advances in Financial Machine Learning by Marcos Lopez de Prado. These texts bridge the gap between theory and practical application.

      Step 4: Practice Backtesting

      Use open-source backtesting frameworks such as Backtrader, Zipline, or QuantConnect to test your strategies on historical data. Focus on understanding performance metrics (Sharpe Ratio, maximum drawdown, win rate) and common pitfalls like look-ahead bias and overfitting.

      Step 5: Start Small and Iterate

      Begin with simple strategies on paper trading accounts before committing real capital. Track your results, refine your models, and scale gradually. Many successful quant traders started with straightforward momentum or mean reversion strategies before progressing to more complex approaches.

      A Brief History of Quantitative Trading

      The origins of quantitative finance trace back to Harry Markowitz’s 1952 paper on portfolio selection, which introduced the concept of mathematically optimizing diversification. In the 1960s and 1970s, the Black-Scholes option pricing model and the Capital Asset Pricing Model (CAPM) laid further theoretical groundwork.

      Ed Thorp, a mathematics professor and author of Beat the Market, is widely credited as one of the first practitioners to apply quantitative methods to trading in the 1960s and 1970s. His success demonstrated that rigorous mathematical approaches could generate consistent returns.

      The 1980s and 1990s saw the rise of electronic trading, Bloomberg terminals, and the designated order turnaround (DOT) system at the New York Stock Exchange. These technological advances made quantitative strategies increasingly viable. Renaissance Technologies, founded by mathematician Jim Simons in 1982, became the gold standard for quant trading with its Medallion Fund, which has generated annualized returns exceeding 60% before fees over several decades.

      Today, quantitative methods dominate institutional trading. Advances in machine learning, cloud computing, and alternative data have expanded what is possible, and the barrier to entry for retail quant traders continues to fall.

      Expert Advice: When building your first quantitative strategy, focus on simplicity and robustness over complexity. A straightforward moving average crossover strategy that survives out-of-sample testing is worth more than a sophisticated machine learning model that overfits. In our experience, adding a one-day lag to signal generation reduces look-ahead bias significantly, and most beginners overlook this step.

      Frequently Asked Questions

      Is quantitative trading profitable?

      Quantitative trading can be highly profitable, as demonstrated by the track records of leading quant hedge funds. Profitability depends on the quality of the strategy, the rigor of the backtesting process, execution efficiency, and risk management discipline. Not every strategy works, and past backtest performance does not guarantee future returns. The most successful quant traders combine strong technical skills with deep market understanding.

      Can individuals do quantitative trading?

      Yes. The tools and data needed for quantitative trading have become significantly more accessible. Open-source platforms like Backtrader and QuantConnect, combined with free or low-cost market data, allow individual traders to develop, test, and deploy quant strategies. You will need programming skills (Python is the most common starting point), a foundation in statistics, and access to a brokerage that supports algorithmic order execution.

      What is the difference between quantitative trading and day trading?

      Day trading is defined by its time horizon: positions are opened and closed within the same trading day. Quantitative trading is defined by its methodology: the use of mathematical models and data to drive decisions. A quantitative trader may hold positions for seconds (in HFT) or months (in factor investing). Some quant strategies are day-trading strategies, but many are not. The key distinction is that quant trading relies on systematic, data-driven rules rather than discretionary judgment.

      What programming language should I learn for quantitative trading?

      Python is the most widely recommended starting language. Its ecosystem of data science libraries (pandas, NumPy, scikit-learn, TensorFlow) and active community make it the standard for research, backtesting, and strategy development. For high-frequency or latency-sensitive applications, C++ is commonly used. R remains relevant in some academic and research contexts. SQL is also valuable for working with databases of market data.

      Do I need a PhD to become a quantitative trader?

      A PhD is not strictly required, but many top quant firms recruit heavily from doctoral programs in mathematics, physics, computer science, and statistics. A strong quantitative background at the master’s level, combined with programming proficiency and demonstrable problem-solving ability, can also open doors. Some firms, like Jane Street, emphasize puzzle-solving and mathematical reasoning over formal credentials. Building a portfolio of backtested strategies and contributing to open-source quant projects can strengthen your candidacy regardless of degree level.

      How much money do I need to start quantitative trading?

      You can begin learning and backtesting strategies with no capital at all, using free data and open-source tools. For live trading, the minimum depends on your brokerage requirements and strategy. Some brokerages allow you to start with as little as $500 to $1,000 for basic systematic strategies. For more serious deployment, $10,000 or more provides a more realistic base for managing position sizing and transaction costs effectively.

      What are the biggest risks of quantitative trading?

      The primary risks include model overfitting, changing market conditions that invalidate a strategy, data quality issues, execution failures, and crowding (too many traders using the same strategy). Technology failures such as software bugs or network outages can also cause significant losses. Effective risk management, including position limits, stop-losses, and diversification across strategies, is essential for mitigating these risks.

      Conclusion

      Quantitative trading represents a fundamental shift in how financial markets are approached: from intuition-driven decisions to data-driven, systematic methods. The field combines mathematics, statistics, programming, and financial knowledge into a discipline that has produced some of the most consistent returns in the investment industry.

      For beginners, the path forward is clear. Start with the fundamentals of probability and statistics, learn Python, study established strategies, and practice backtesting rigorously before deploying real capital. The learning curve is steep, but the resources available today (free courses, open-source tools, community forums) make quantitative trading more accessible than at any point in history.

      Whether your goal is a career at a leading quant firm or building systematic strategies for your own portfolio, the principles remain the same: let data guide your decisions, validate your ideas with rigorous testing, and manage risk at every step.