| Key Takeaway: Quantitative trading uses mathematical models, statistical analysis, and computer algorithms to identify and execute trades in financial markets. Once limited to large hedge funds and investment banks, quant trading is now accessible to individual traders with the right tools and knowledge. This guide covers how it works, the most common strategies, career paths, and the skills you need to get started. |
Financial markets generate millions of data points every second. Prices shift, volumes spike, and patterns emerge across thousands of instruments simultaneously. No human trader can process all of this information in real time. Quantitative trading solves this problem by using mathematics, statistics, and computing power to analyze data and make trading decisions systematically.
The approach has grown rapidly over the past two decades. Firms like Renaissance Technologies, Citadel, Two Sigma, and DE Shaw have generated billions of dollars in returns using quantitative methods. According to research from the Tabb Group, algorithmic and quantitative strategies now account for a significant share of daily trading volume on major exchanges. The trend continues to accelerate as computing costs fall and data availability expands.
This guide explains what quantitative trading is, how it works, and why it matters. Whether you are exploring a career in quantitative finance or considering systematic approaches for your own portfolio, you will find a practical foundation here.
What Is Quantitative Trading?
Quantitative trading, often called quant trading, is a method of trading financial instruments that relies on quantitative analysis. This means trade decisions are based on mathematical computations and statistical models rather than subjective judgment or gut instinct. The core inputs to these models are typically price and volume data, although modern quant strategies also incorporate alternative datasets such as satellite imagery, social media sentiment, and economic indicators.
In practice, a quant trader develops a hypothesis about market behavior, for example, that stocks which have dropped significantly below their historical average tend to rebound. The trader then translates this hypothesis into a mathematical model, tests it against historical data (a process called backtesting), and deploys the model to generate trade signals. Execution can be manual, semi-automated, or fully automated depending on the strategy.
Quantitative trading is used by hedge funds, proprietary trading firms, investment banks, and increasingly by retail traders who have access to affordable data and computing tools. The goal is consistent: remove human emotion from the trading process and replace it with data-driven, repeatable decision-making.
How Does Quantitative Trading Work?
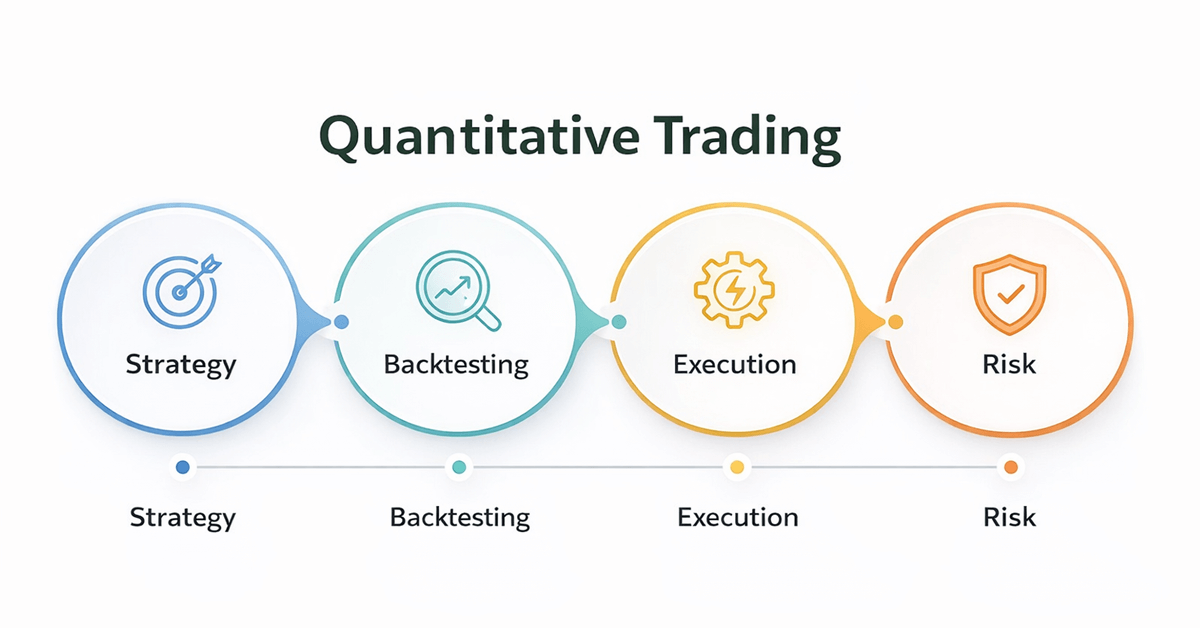
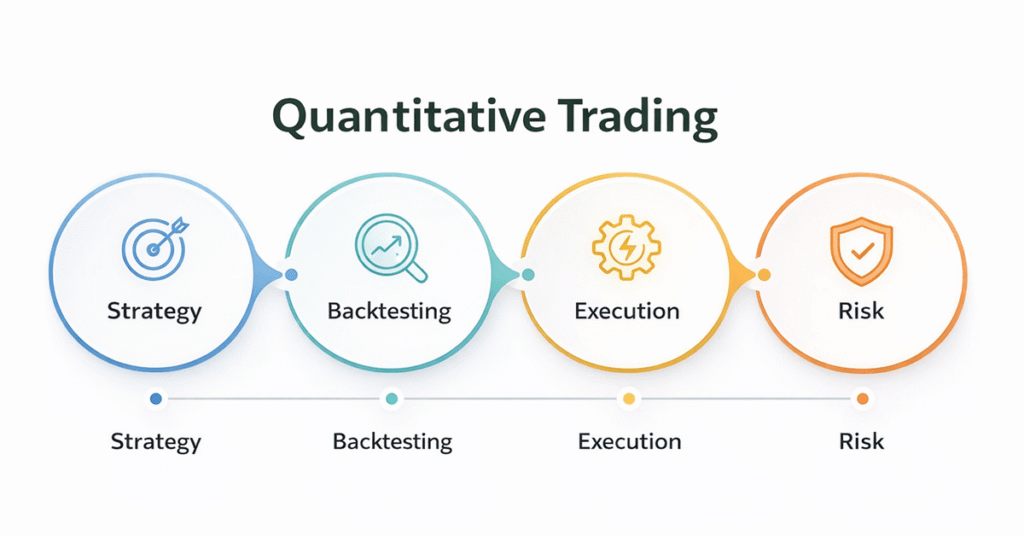
Every quantitative trading system follows a structured workflow. While the specifics vary by firm and strategy, the process generally involves four core stages: strategy identification, backtesting, execution, and risk management.
1. Strategy Identification
The process begins with research. Quant traders analyze market data to find patterns, inefficiencies, or statistical relationships that can be exploited for profit. These ideas can come from academic research, financial theory, or empirical observation. For example, a trader might study whether stocks in the same industry sector tend to move together and whether temporary divergences offer a trading opportunity. The key is identifying a repeatable pattern with a statistically significant edge.
2. Backtesting
Once a strategy is defined, it must be tested against historical market data. Backtesting simulates how the strategy would have performed in the past, accounting for factors like transaction costs, slippage, and data quality. A robust backtest evaluates performance metrics such as the Sharpe Ratio (a measure of risk-adjusted return), maximum drawdown (the largest peak-to-trough decline), and overall profitability. Positive backtest results do not guarantee future success, but they help filter out strategies that would have failed historically.
3. Execution
A validated strategy is then deployed in live markets. The execution system translates trade signals from the model into actual buy and sell orders sent to a brokerage or exchange. Many quant strategies use automated execution systems to minimize latency and reduce the risk of human error. For high-frequency strategies, execution speed is critical, as market inefficiencies may exist for only fractions of a second.
4. Risk Management
No trading strategy works in all market conditions. Effective risk management protects capital when a strategy underperforms. Common risk management techniques include position sizing rules, stop-loss orders, portfolio diversification, and real-time monitoring of exposure. Quant firms also use tools like Value-at-Risk (VaR) calculations and stress testing to anticipate how portfolios might behave under extreme market scenarios.
Core Components of a Quantitative Trading System
The table below summarizes the essential building blocks of a quantitative trading system and why each one matters.
| Component | Description | Why It Matters |
| Data | Price, volume, fundamental, and alternative datasets | Raw material for all models and decisions |
| Mathematical Models | Statistical formulas that identify patterns and predict outcomes | Transform raw data into actionable trade signals |
| Backtesting Engine | Software that simulates strategy performance on historical data | Validates strategies before risking real capital |
| Execution System | Automated or semi-automated order routing to exchanges | Ensures trades are placed quickly and accurately |
| Risk Management | Rules and monitoring for position sizing, exposure, and drawdown limits | Protects capital during adverse market conditions |
Common Quantitative Trading Strategies
Quantitative traders employ a wide range of strategies. The choice depends on the trader’s expertise, available data, capital, and risk tolerance. Below are six of the most widely used approaches.
Mean Reversion
Mean reversion strategies are based on the idea that asset prices tend to return to their historical average over time. When a stock’s price moves significantly above or below its average, a mean reversion model predicts that it will eventually correct back toward the mean. Traders using this approach buy assets that appear undervalued relative to their historical norm and sell those that appear overvalued. This strategy works best in range-bound, liquid markets and requires careful calibration to avoid catching assets in genuine structural decline.
Momentum Trading (Trend Following)
Momentum strategies take the opposite view from mean reversion. They assume that assets which have been rising will continue to rise, and those falling will continue to fall. Momentum traders look for sustained directional moves and enter positions in the direction of the trend. The strategy dates back to the famous Turtle Traders experiment of the 1980s and remains popular today, although increased competition has reduced the magnitude of opportunities compared to earlier decades.
Statistical Arbitrage
Statistical arbitrage, often called stat arb, involves trading portfolios of related securities based on statistical relationships. A classic example is pairs trading: if two historically correlated stocks diverge in price, the trader goes long on the underperformer and short on the outperformer, expecting the spread to narrow. Modern stat arb strategies may trade hundreds or thousands of instruments simultaneously and rely on machine learning to identify subtle correlations.
High-Frequency Trading (HFT)
High-frequency trading is a subset of quantitative trading characterized by extremely fast execution speeds, high trade volumes, and very short holding periods. HFT firms use specialized hardware and co-located servers positioned physically close to exchange data centers to gain speed advantages measured in microseconds. Common HFT strategies include market making (providing liquidity by quoting bid and ask prices) and latency arbitrage (exploiting tiny price differences across venues). HFT requires significant infrastructure investment and is primarily practiced by well-capitalized firms.
Factor-Based Investing
Factor investing systematically targets specific drivers of return, such as value, momentum, size, quality, or low volatility. Academic research, starting with the Fama-French three-factor model, has identified several factors that historically explain stock returns beyond overall market movements. Quant funds build portfolios that are intentionally tilted toward these factors, aiming to capture persistent risk premiums over time.
Sentiment Analysis
Modern quant strategies increasingly incorporate alternative data sources, including news articles, social media posts, earnings call transcripts, and satellite imagery. Natural language processing (NLP) algorithms analyze text data to gauge market sentiment and generate trade signals. For example, a model might predict short-term stock movements based on the tone of a CEO’s earnings call or the volume of positive mentions on financial forums.
Quantitative Trading Strategies at a Glance
| Strategy | Core Idea | Holding Period | Complexity | Best For |
| Mean Reversion | Prices revert to historical average | Days to weeks | Moderate | Range-bound markets |
| Momentum | Trends continue in the same direction | Weeks to months | Moderate | Trending markets |
| Statistical Arbitrage | Exploit price divergences in related assets | Hours to days | High | Highly liquid pairs |
| HFT | Speed advantage in order execution | Seconds or less | Very High | Firms with infrastructure |
| Factor Investing | Target persistent return drivers | Months to years | Moderate | Long-term portfolios |
| Sentiment Analysis | Trade on news and social data signals | Hours to days | High | Event-driven trading |
Quantitative Trading vs. Algorithmic Trading
These two terms are often used interchangeably, but they refer to different aspects of the trading process. Understanding the distinction helps clarify what quant trading actually involves.
Quantitative trading focuses on the research and strategy development side. It uses mathematical and statistical models to answer the question: “What should I trade, and why?” The emphasis is on identifying patterns, modeling market behavior, and generating trade signals backed by data.
Algorithmic trading focuses on the execution side. It uses pre-programmed computer instructions to carry out trades automatically based on defined rules. An algorithm answers the question: “How should I execute this trade most efficiently?”
In practice, the two overlap significantly. Many quant traders use algorithms to execute their strategies, and most algorithmic trading systems incorporate some level of quantitative analysis. The simplest way to think about it: quantitative trading is about finding the edge, while algorithmic trading is about capturing that edge efficiently.
| Aspect | Quantitative Trading | Algorithmic Trading |
| Primary Focus | Strategy development and signal generation | Trade execution and order management |
| Core Tools | Statistical models, machine learning, data analysis | Pre-programmed rules, execution algorithms |
| Complexity | High (requires math, statistics, programming) | Moderate to high (requires programming) |
| Typical Users | Hedge funds, prop firms, quant researchers | Institutional and retail traders |
| Execution | Can be manual or automated | Always automated |
Advantages of Quantitative Trading
Data-Driven Decision Making
Quantitative models can process vast amounts of information across thousands of instruments simultaneously. A traditional discretionary trader might monitor a handful of stocks. A quant system can scan the entire market in real time, identifying opportunities that would be impossible to detect manually.
Elimination of Emotional Bias
Fear and greed are two of the most common reasons traders lose money. Quant systems operate on predefined rules and do not second-guess their decisions based on emotion. This removes cognitive biases such as loss aversion, confirmation bias, and anchoring, which routinely affect discretionary traders.
Backtesting and Validation
Before committing real capital, quant traders can test their ideas against years or decades of historical data. This provides a level of validation that is difficult to achieve with discretionary approaches. Backtesting also allows traders to stress-test strategies under different market regimes, from bull markets to financial crises.
Scalability
A well-built quant system can trade one strategy or fifty with roughly the same operational effort. This scalability is a significant advantage for firms managing large portfolios across multiple asset classes and geographies.
Speed and Consistency
Automated quant systems execute trades with speed and consistency that human traders cannot match. They follow the same rules on the first trade of the day and the last, regardless of fatigue, distraction, or market stress.
Disadvantages and Risks of Quantitative Trading
Model Risk and Overfitting
A model that performs brilliantly on historical data may fail in live markets. This is often due to overfitting, where a model is tuned so precisely to past data that it captures noise rather than genuine patterns. Overfitted strategies tend to break down quickly when market conditions change.
Market Regime Changes
Financial markets are dynamic. Correlations shift, volatility regimes change, and unprecedented events occur. A strategy calibrated to one market environment may perform poorly when conditions evolve. The 2008 financial crisis, the 2020 COVID crash, and the 2022 rate hike cycle each caused significant losses for strategies that failed to adapt.
High Barriers to Entry
Developing quantitative strategies requires expertise in mathematics, statistics, programming, and financial markets. The learning curve is steep, and the infrastructure costs for data, computing power, and connectivity can be substantial, particularly for strategies that require low latency or alternative data.
Data Quality Dependency
Quant models are only as good as the data they consume. Inaccurate, incomplete, or biased data leads to flawed conclusions and potentially significant financial losses. Survivorship bias (analyzing only assets that still exist, ignoring those that failed) is a common data-quality pitfall in backtesting.
Crowding Risk
As more firms deploy similar quantitative strategies, the opportunities those strategies exploit can become crowded. When many traders act on the same signal simultaneously, it can reduce returns or cause sharp reversals, a phenomenon sometimes called a “quant quake.”
Quantitative Trading as a Career
Quantitative finance is one of the highest-paying fields in the financial industry. The combination of advanced technical skills and direct impact on trading profits creates significant earning potential.
Salary Overview
Compensation in quantitative trading varies widely based on role, experience, and firm type. Entry-level quantitative analysts at major firms typically earn base salaries in the range of $150,000 to $200,000 per year, with total compensation (including bonuses) often exceeding $250,000. Senior quant traders and portfolio managers at top hedge funds can earn $1 million or more annually, with exceptional performers at firms like Citadel, Jane Street, and Two Sigma earning significantly higher through performance-based compensation. Jane Street, for example, lists a base salary of $300,000 for quantitative trader positions.
Required Skills
Mathematics and Statistics: Probability theory, stochastic calculus, linear algebra, and time series analysis form the quantitative foundation. Comfort with concepts like the Sharpe Ratio, Monte Carlo simulation, and regression modeling is essential.
Programming: Python is the most widely used language in quantitative finance, valued for its extensive data science libraries (pandas, NumPy, scikit-learn). C++ remains important for latency-sensitive applications, and R is used in some research environments. SQL skills are also valuable for working with large datasets.
Financial Markets Knowledge: Understanding how different asset classes work (equities, fixed income, derivatives, commodities, currencies) and how exchanges, brokerages, and market microstructure operate is fundamental.
Machine Learning: Modern quant roles increasingly require familiarity with machine learning techniques, including supervised and unsupervised learning, neural networks, and natural language processing for alternative data analysis.
Common Roles in Quantitative Trading
| Role | Description |
| Quantitative Researcher | Develops and tests trading strategies using mathematical models and data analysis |
| Quantitative Trader | Executes strategies in live markets, manages positions, and monitors performance |
| Quantitative Developer | Builds and maintains the software infrastructure for research, backtesting, and execution |
| Risk Quant | Models and monitors portfolio risk, develops risk management frameworks |
| Data Scientist / Analyst | Sources, cleans, and analyzes data; builds pipelines for alternative data integration |
Top Quantitative Trading Firms
Some of the most prominent quantitative trading firms include Renaissance Technologies (known for the Medallion Fund), Citadel Securities, Two Sigma, DE Shaw, Jane Street, Virtu Financial, Jump Trading, and AQR Capital Management. These firms recruit heavily from top universities and value candidates with strong quantitative backgrounds in mathematics, physics, computer science, or engineering.
How to Get Started with Quantitative Trading
Breaking into quantitative trading requires a structured approach. Below is a practical roadmap for beginners.
Step 1: Build Your Mathematical Foundation
Start with probability, statistics, and linear algebra. These subjects underpin every quantitative strategy. Free resources from MIT OpenCourseWare, Khan Academy, and textbooks like Introduction to Probability and Statistics by Sheldon Ross provide strong starting points.
Step 2: Learn Python for Finance
Python is the industry standard for quantitative analysis. Focus on libraries like pandas for data manipulation, NumPy for numerical computing, matplotlib for visualization, and scikit-learn for machine learning. Practice by analyzing real market data from free sources like Yahoo Finance or Alpha Vantage.
Step 3: Study Quantitative Finance Fundamentals
Read foundational books such as Quantitative Trading: How to Build Your Own Algorithmic Trading Business by Ernie Chan and Advances in Financial Machine Learning by Marcos Lopez de Prado. These texts bridge the gap between theory and practical application.
Step 4: Practice Backtesting
Use open-source backtesting frameworks such as Backtrader, Zipline, or QuantConnect to test your strategies on historical data. Focus on understanding performance metrics (Sharpe Ratio, maximum drawdown, win rate) and common pitfalls like look-ahead bias and overfitting.
Step 5: Start Small and Iterate
Begin with simple strategies on paper trading accounts before committing real capital. Track your results, refine your models, and scale gradually. Many successful quant traders started with straightforward momentum or mean reversion strategies before progressing to more complex approaches.
A Brief History of Quantitative Trading
The origins of quantitative finance trace back to Harry Markowitz’s 1952 paper on portfolio selection, which introduced the concept of mathematically optimizing diversification. In the 1960s and 1970s, the Black-Scholes option pricing model and the Capital Asset Pricing Model (CAPM) laid further theoretical groundwork.
Ed Thorp, a mathematics professor and author of Beat the Market, is widely credited as one of the first practitioners to apply quantitative methods to trading in the 1960s and 1970s. His success demonstrated that rigorous mathematical approaches could generate consistent returns.
The 1980s and 1990s saw the rise of electronic trading, Bloomberg terminals, and the designated order turnaround (DOT) system at the New York Stock Exchange. These technological advances made quantitative strategies increasingly viable. Renaissance Technologies, founded by mathematician Jim Simons in 1982, became the gold standard for quant trading with its Medallion Fund, which has generated annualized returns exceeding 60% before fees over several decades.
Today, quantitative methods dominate institutional trading. Advances in machine learning, cloud computing, and alternative data have expanded what is possible, and the barrier to entry for retail quant traders continues to fall.
| Expert Advice: When building your first quantitative strategy, focus on simplicity and robustness over complexity. A straightforward moving average crossover strategy that survives out-of-sample testing is worth more than a sophisticated machine learning model that overfits. In our experience, adding a one-day lag to signal generation reduces look-ahead bias significantly, and most beginners overlook this step. |
Frequently Asked Questions
Is quantitative trading profitable?
Quantitative trading can be highly profitable, as demonstrated by the track records of leading quant hedge funds. Profitability depends on the quality of the strategy, the rigor of the backtesting process, execution efficiency, and risk management discipline. Not every strategy works, and past backtest performance does not guarantee future returns. The most successful quant traders combine strong technical skills with deep market understanding.
Can individuals do quantitative trading?
Yes. The tools and data needed for quantitative trading have become significantly more accessible. Open-source platforms like Backtrader and QuantConnect, combined with free or low-cost market data, allow individual traders to develop, test, and deploy quant strategies. You will need programming skills (Python is the most common starting point), a foundation in statistics, and access to a brokerage that supports algorithmic order execution.
What is the difference between quantitative trading and day trading?
Day trading is defined by its time horizon: positions are opened and closed within the same trading day. Quantitative trading is defined by its methodology: the use of mathematical models and data to drive decisions. A quantitative trader may hold positions for seconds (in HFT) or months (in factor investing). Some quant strategies are day-trading strategies, but many are not. The key distinction is that quant trading relies on systematic, data-driven rules rather than discretionary judgment.
What programming language should I learn for quantitative trading?
Python is the most widely recommended starting language. Its ecosystem of data science libraries (pandas, NumPy, scikit-learn, TensorFlow) and active community make it the standard for research, backtesting, and strategy development. For high-frequency or latency-sensitive applications, C++ is commonly used. R remains relevant in some academic and research contexts. SQL is also valuable for working with databases of market data.
Do I need a PhD to become a quantitative trader?
A PhD is not strictly required, but many top quant firms recruit heavily from doctoral programs in mathematics, physics, computer science, and statistics. A strong quantitative background at the master’s level, combined with programming proficiency and demonstrable problem-solving ability, can also open doors. Some firms, like Jane Street, emphasize puzzle-solving and mathematical reasoning over formal credentials. Building a portfolio of backtested strategies and contributing to open-source quant projects can strengthen your candidacy regardless of degree level.
How much money do I need to start quantitative trading?
You can begin learning and backtesting strategies with no capital at all, using free data and open-source tools. For live trading, the minimum depends on your brokerage requirements and strategy. Some brokerages allow you to start with as little as $500 to $1,000 for basic systematic strategies. For more serious deployment, $10,000 or more provides a more realistic base for managing position sizing and transaction costs effectively.
What are the biggest risks of quantitative trading?
The primary risks include model overfitting, changing market conditions that invalidate a strategy, data quality issues, execution failures, and crowding (too many traders using the same strategy). Technology failures such as software bugs or network outages can also cause significant losses. Effective risk management, including position limits, stop-losses, and diversification across strategies, is essential for mitigating these risks.
Conclusion
Quantitative trading represents a fundamental shift in how financial markets are approached: from intuition-driven decisions to data-driven, systematic methods. The field combines mathematics, statistics, programming, and financial knowledge into a discipline that has produced some of the most consistent returns in the investment industry.
For beginners, the path forward is clear. Start with the fundamentals of probability and statistics, learn Python, study established strategies, and practice backtesting rigorously before deploying real capital. The learning curve is steep, but the resources available today (free courses, open-source tools, community forums) make quantitative trading more accessible than at any point in history.
Whether your goal is a career at a leading quant firm or building systematic strategies for your own portfolio, the principles remain the same: let data guide your decisions, validate your ideas with rigorous testing, and manage risk at every step.
Leave a Reply